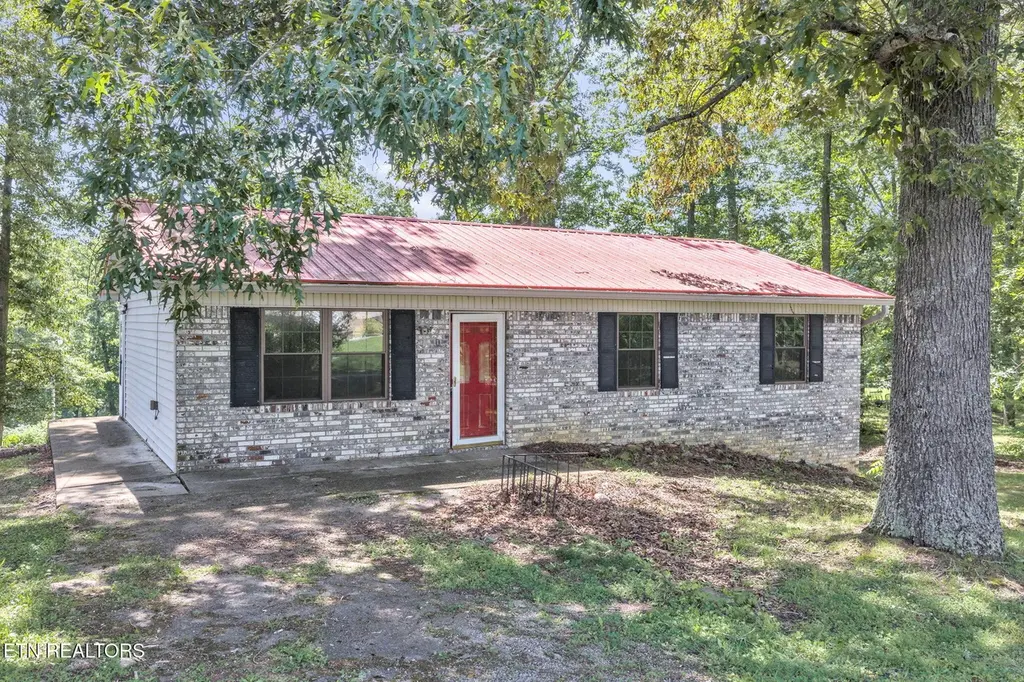
322 Idlewild Dr
Baneberry, TN 37890
$199,900D+
3 bd · 1.0 ba ·
1,092 sqft ·
Built 1979
· SingleFamily
· Active
· 18 DOM
Cashflow @ list (25.0% down · 7.5%)
Estimated rent
$1,325/mo
Mortgage (P&I)
−$1,048
Tax + insurance
−$154
HOA
−$0
Vac / Maint / Mgmt
−$278
Net cashflow
$-155/mo
Annual
$-1,863/yr
Cap rate
5.36%
Cash-on-cash
-3.33%
DSCR
0.85
1% rule
0.66%
Cash to close
$55,972
Investor read
- This is a 3-bed/1.0-bath single-family listed at $200k.
- At list price, monthly cash flow is $-155 ($-2k/yr) — negative.
- To cash-flow at today's rent, offer at most $172k (13.7% below list).
- To meet the 1% rule (rent ≥ 1% of price), the offer needs to be $133k (33.7% below list).
- It's been on market 18 days — a 2% lower offer ($197k) is reasonable based on typical stale-listing flexibility.
- Recommended offer: $133k (33.7% below list) — sets the bar for 1% rule.
- In year one you build about $19k of equity ($1k loan paydown + $17k appreciation (8.6% local appreciation)).
- Location reads 67/100 on livability (#97 in TN) — a middle-class / working-renter tenant base. Strengths: employment A+, cost of living A+, housing A+; Watch: amenities F, commute F, health & safety F.
- Jefferson County (rural): math 25% / reading 27% proficiency, ranked #80 of 139 in TN (top 58%) — low school quality limits family demand, transient renter base, plan for 1-2y turnover.
- Market conditions: 118 active listings in the ZIP; 254 units permitted in Jefferson County in 2024 (0 in 5+ unit buildings).
- Jefferson County population projected at +6% by 2050 — modest demand growth; plan on rents tracking national, not racing it.
- Current owner paid $33k; list at $200k implies a 513% gain — meaningful room to come down on a strong offer.
- By year 3, paydown + projected appreciation supports a ~$47k cash-out refi (75% LTV) — recoverable capital for the next deal without selling this one.
- Climate carrying-cost: moderate wildfire risk; extreme-heat days projected 7→20/yr by 2055 (HVAC capex compounding) — expect insurance premiums to compound above CPI over the hold.
- Cap rate 5.4% vs local median 0.8% in Baneberry — top-decile yield for the area; either an underpriced asset or a hidden risk that comps aren't pricing in. Stress-test before assuming the spread holds.
Questions for listing agent
- What do current leases actually rent for vs. the listed asking? Can we see a recent rent roll and the last 12 months of T-12 income?
- Built in 1979 — when were the roof, HVAC, electrical panel, plumbing, and water heater last replaced?
- Is there a deadline driving the sale (1031 exchange, divorce, estate, relocation)? That informs how much negotiation room exists.
- Schools are F-rated, which usually means shorter tenancies and higher turnover. Who's the typical renter profile here, and what's been the actual vacancy rate?
- The area grade is low — what's the realistic commute time and amenity access for the typical tenant pool here? Any planned neighborhood developments (good or bad) we should know about?
- What's the average days-on-market for RENTAL listings here right now (not sales)? A rising rental-DOM trend means longer vacancies and softer asking-rent achievability than the comps imply.
- What's the recent tenant-quality profile in this submarket — average credit score on applications, eviction rate, late-payment / NSF rate, and stable-employment percentage? A property-management company in the area should have these aggregated.
- How much new for-sale + rental construction is in the pipeline within 1–3 miles? Heavy new supply typically softens prices + rents 12–24 months out; constrained supply supports both.
CashFlowRE · CFR-RANY240KHC9SYN
· Data 1 day ago
cashflowre.app · 2026-05-29