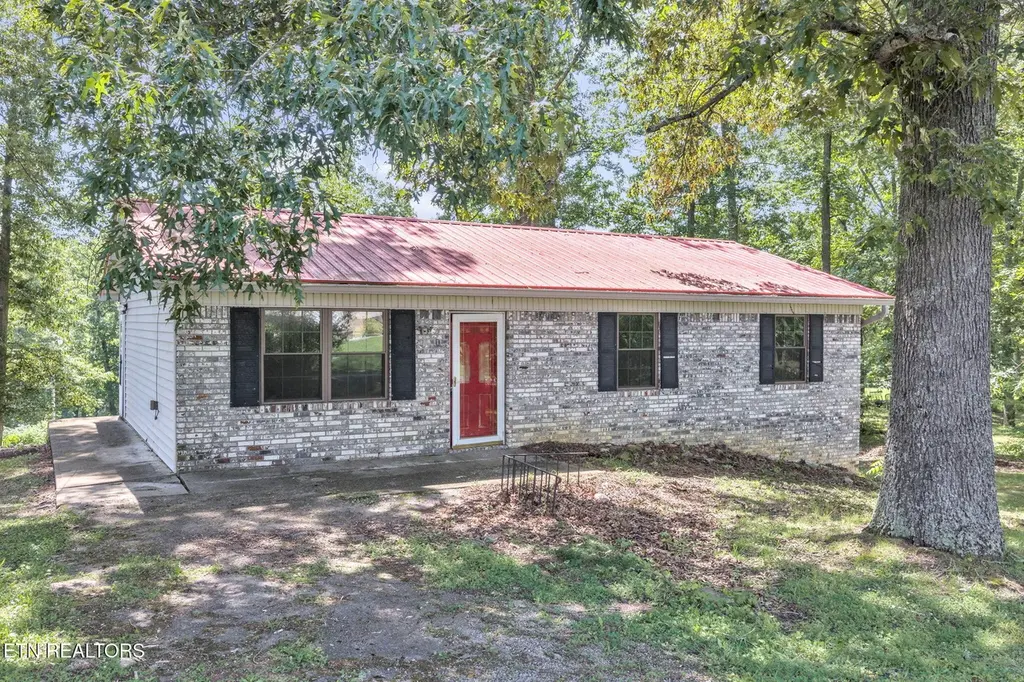
322 Idlewild Dr · Baneberry, TN
Flood risk 1/10 · Minimal
- FEMA flood zone
- X (unshaded)
- Chance of flooding over 30 yrs
- 0.0%
- Est. flood insurance / yr
- $473 – $860
Fire risk 5/10 · Moderate
- Est. fire insurance / yr
- $949 – $1,763
Heat risk 5/10 · Moderate
- Hot days now (above 102°F)
- 7 days/yr
- Hot days in 30 yrs
- 20 days/yr
Wind risk 2/10 · Minimal
- Chance of severe wind over 30 yrs
- —
Air-quality risk 3/10 · Minor
- Unhealthy air days now
- 3 days/yr
- Unhealthy air days in 30 yrs
- 3 days/yr
Risk factors via First Street. Map © Google.
Why this score? — see what drove the D+ grade
The composite is a weighted blend of 9 inputs, each scored 0–100. Each bar is that input's sub-score; the figure is the points it added to the 100-point composite (weight × sub-score).
- ARV discount +14.4/15.0
- Appreciation +9.3/10.0
- Cash flow +9.1/30.0
- Livability +3.4/5.0
- DSCR +2.5/10.0
- Rent growth +2.5/5.0
- Condition / age +2.5/5.0
- Schools +2.2/10.0
- 1% rule +1.6/10.0
$199,900
🖨 Deal sheet 📄 Offer letter ✓ Due diligence
Listing remarks
I would revise it to position the home as a solid candidate for updating rather than implying it is move-in ready. This is a more accurate and buyer-friendly approach: Basement Rancher with Expansion Potential - 322 Idlewild Drive, White Pine, TN 37890 - Jefferson County Tennessee Welcome to 322 Idlewild Drive, located in the established Wilmore Estates community of White Pine, Tennessee. Situated on approximately 0.46 acres in Jefferson County, this basement rancher offers a fantastic opportunity for buyers seeking a home with strong fundamentals, future potential, and the ability to add value through updates and personalization. The main level features approximately 1,092 square fee
Key facts
- 0.46 acres
- Expansion potential
- Basement rancher
Tags
Property features AI
Exterior
- Parking: Off-street parking
- Utilities: Septic tank
- Home design: Detached property
- Construction: Vinyl siding, brick and frame construction
- Exterior features: Country setting view; Irregular lot
Interior
- Flooring: Laminate flooring; Vinyl flooring
- Bathrooms: 1 full bathroom
- Heating & cooling: Central electric heating; Central cooling
- Interior features: 5 total rooms; Walkout unfinished basement
Neighborhood map
What this means for you Summary
Snapshot
- This is a 3-bed/1.0-bath single-family listed at $200k.
Deal economics
- At list price, monthly cash flow is $-155 ($-2k/yr) — negative.
- To cash-flow at today's rent, offer at most $172k (13.7% below list).
- To meet the 1% rule (rent ≥ 1% of price), the offer needs to be $133k (33.7% below list).
- Recommended offer: $133k (33.7% below list) — sets the bar for 1% rule.
- Cap rate 5.4% vs local median 0.8% in Baneberry — top-decile yield for the area; either an underpriced asset or a hidden risk that comps aren't pricing in. Stress-test before assuming the spread holds.
Location & tenants
- Location reads 67/100 on livability (#97 in TN) — a middle-class / working-renter tenant base. Strengths: employment A+, cost of living A+, housing A+; Watch: amenities F, commute F, health & safety F.
- Jefferson County (rural): math 25% / reading 27% proficiency, ranked #80 of 139 in TN (top 58%) — low school quality limits family demand, transient renter base, plan for 1-2y turnover.
- Market conditions: 118 active listings in the ZIP; 254 units permitted in Jefferson County in 2024 (0 in 5+ unit buildings).
Forward outlook
- In year one you build about $19k of equity ($1k loan paydown + $17k appreciation (8.6% local appreciation)).
- Jefferson County population projected at +6% by 2050 — modest demand growth; plan on rents tracking national, not racing it.
- By year 3, paydown + projected appreciation supports a ~$47k cash-out refi (75% LTV) — recoverable capital for the next deal without selling this one.
Negotiation context
- It's been on market 18 days — a 2% lower offer ($197k) is reasonable based on typical stale-listing flexibility.
- Current owner paid $33k; list at $200k implies a 513% gain — meaningful room to come down on a strong offer.
Risks & watch-outs
- Climate carrying-cost: moderate wildfire risk; extreme-heat days projected 7→20/yr by 2055 (HVAC capex compounding) — expect insurance premiums to compound above CPI over the hold.
Questions for the listing agent
- What do current leases actually rent for vs. the listed asking? Can we see a recent rent roll and the last 12 months of T-12 income?
- Built in 1979 — when were the roof, HVAC, electrical panel, plumbing, and water heater last replaced?
- Is there a deadline driving the sale (1031 exchange, divorce, estate, relocation)? That informs how much negotiation room exists.
- Schools are F-rated, which usually means shorter tenancies and higher turnover. Who's the typical renter profile here, and what's been the actual vacancy rate?
- The area grade is low — what's the realistic commute time and amenity access for the typical tenant pool here? Any planned neighborhood developments (good or bad) we should know about?
- What's the average days-on-market for RENTAL listings here right now (not sales)? A rising rental-DOM trend means longer vacancies and softer asking-rent achievability than the comps imply.
- What's the recent tenant-quality profile in this submarket — average credit score on applications, eviction rate, late-payment / NSF rate, and stable-employment percentage? A property-management company in the area should have these aggregated.
- How much new for-sale + rental construction is in the pipeline within 1–3 miles? Heavy new supply typically softens prices + rents 12–24 months out; constrained supply supports both.
Investment metrics
- 1% rule
- 0.66% ✗
- Cap rate
- 5.36%
- Cash-on-cash
- -3.33%
- DSCR
- 0.85
- GRM
- 12.6
CMA / ARV
- ARV (on-the-fly)
- $235,872
- Comps found
- 4
Show comp detail 4 sales within ~0.75 mi
| Address | Dist | Beds/Ba | Sqft | Sold | Price | $/sf | Match |
|---|---|---|---|---|---|---|---|
| 3459 Nina Rd | 0.74mi | 3/1.0 | 1,083 (-1%) | 13mo | $235,000 | $217 | 53 |
| 3318 Windjammer Rd | 0.54mi | 3/2.0 | 1,250 (+14%) | 10mo | $260,000 | $208 | 39 |
| 322 Harrison Ferry Rd | 0.60mi | 3/2.0 | 1,250 (+14%) | 10mo | $270,000 | $216 | 36 |
| 318 Harrison Ferry Rd | 0.67mi | 3/2.0 | 1,250 (+14%) | 7mo | $264,000 | $211 | 35 |
Match score weights: distance 35% · size 25% · config 20% · recency 20%. Top-matched comps best support the ARV.
Projected returns pro-forma
8.61% appreciation · 3.0% rent growth · sell at horizon
- IRR
- 18.8%
- Equity multiple
- 2.43×
- Total profit
- $80,251
- Equity at exit
- $160,253
- IRR
- 17.6%
- Equity multiple
- 5.30×
- Total profit
- $240,621
- Equity at exit
- $326,446
Cash invested: $55,972 (down + closing). Projections, not guarantees.
Landlord ↔ Tenant lean methodology
- Overall (STATE)
- 87 Strongly Landlord-Friendly
- State Tennessee
- 87 Strongly Landlord-Friendly · R+13
- County
- — inherits STATE
- City
- — inherits STATE
ZIP-level market 37890
- Home prices YoY
- 2.7%
- Active inventory
- 118
- Price-to-rent
- 12.6×
Monthly cashflow live
- Estimated rent
- $1,325 medium interval (Pro) →
- Mortgage (P&I)
- −$1,048
- Tax from tax record
- −$71 /mo · $847/yr
- Insurance
- −$83
- HOA
- −$0
- Vacancy / Maint / Mgmt
- −$278
- Net cashflow
- $-155
Break-even live
UW: 25.0% down · 7.5% · 30yr · 1.5% tax · 5.0% vac · 8.0% maint · 8.0% mgmt
Financing live
Cash to close
- Down payment
- $49,975
- Closing costs
- $5,997
- Reserves months
- —
- Total cash needed
- —
Loan-product check · same deal, 3 products live
Conventional
25% down · 7.5% · 30yr
- Down + closing
- —
- Monthly P&I
- —
- Monthly cashflow
- —
- DSCR
- —
- Eligible?
- —
Personal DTI + credit; lowest rate.
DSCR
20% down · 8.5% · 30yr
- Down + closing
- —
- Monthly P&I
- —
- Monthly cashflow
- —
- DSCR
- —
- Eligible?
- —
No personal income docs; deal must DSCR.
Hard money
10% down · 12.0% · 12mo
- Down + closing
- —
- Monthly P&I
- —
- Monthly cashflow
- —
- DSCR
- —
- Eligible?
- —
Short-term bridge; refi at stabilization.
Listing history 15 events
-
2026-06-19days on market $199,900 Active 18 DOM
-
2026-06-18days on market $199,900 Active 17 DOM
-
2026-06-17days on market $199,900 Active 16 DOM
-
2026-06-16days on market $199,900 Active 15 DOM
-
2026-06-15days on market $199,900 Active 14 DOM
-
2026-06-14days on market $199,900 Active 12 DOM
-
2026-06-13days on market $199,900 Active 11 DOM
-
2026-06-10days on market $199,900 Active 9 DOM
-
2026-06-09days on market $199,900 Active 8 DOM
-
2026-06-08days on market $199,900 Active 7 DOM
-
2026-06-07days on market $199,900 Active 6 DOM
-
2026-06-05days on market $199,900 Active 3 DOM
-
2026-06-03days on market $199,900 Active 2 DOM
-
2026-06-02remarks 699-char remark
-
2026-06-02$199,900 Active 1 DOM
ⓘ Source: listings_history table (triggers on properties + properties_extension) + one-shot
backfill from property_details.listing_events for pre-trigger history.
Tax reassessment forecast TN · Resets to sale price
- Current annual tax
- $847 · $71/mo
- Projected year-2 tax
- $1,419 · $118/mo
- Expected delta
- +$572/yr (+$48/mo · 67.6%)
ⓘ Screening estimate from a state-policy table — verify with the county assessor before closing.
Climate risk First Street
- Flood 1/10 Low FEMA zone X (unshaded) · 0% chance over 30 yrs
- Wildfire 5/10 Major
- Heat 5/10 Major 7 d/yr ≥102°F today · 20 d/yr by 30 yrs out
- Wind 2/10 Low
- Air quality 3/10 Moderate 3 unhealthy d/yr today · 3 by 30 yrs out
Nearby sold comps map
Loading sold comps map…
Walkable amenities ~0.75 mi
Loading nearby amenities…
Taxation est. · year 1
- Rental income
- $15,903
- − Mortgage interest
- −$11,198
- − Property taxes
- −$847
- − Insurance
- −$1,000
- − Repairs & maintenance
- −$1,272
- − Management
- −$1,272
- − Depreciation
- −$5,815
- Taxable loss
- −$5,501
- Est. tax savings @ 24.0%
- +$1,320
- After-tax cash flow
- $-543/yr
For passive investors: Depreciation is non-cash, so a rental often shows a tax loss while cash-flowing — sheltering income. Rental losses are passive: they offset passive income freely, and up to $25,000/yr can offset ordinary (W-2) income if you actively participate and your MAGI is under $100k (phasing out to $0 by $150k); unused losses carry forward. On sale, claimed depreciation is recaptured at up to 25%, and gains may owe capital-gains tax (a 1031 exchange can defer both). Figures are a year-1 estimate at your 24.0% rate — not tax advice; consult a CPA.
Schools (NCES district)
- District
- Jefferson County
- NCES district ID
- 4702100
- Math proficiency
- 25% ▼ -7.00%
- Reading proficiency
- 27% ▼ -4.00%
- Median HH income
- $41,074
- Composite
- 22.03/100
- National rank
- #8204
- State rank
- #80 of 139 in TN
Livability — Baneberry
- Score
- 67/100
- State rank
- #97
- US rank
- #10328
Category grades
Schools grade is shown separately in the Schools card above.
Census & demographics
- Population (ZIP)
- 7,218
Population outlook (Jefferson County) Hauer SSP2
- Today (2025)
- 56,862 people
- By 2030
- 58,186 · +2.3%
- By 2040
- 60,025 · +5.6%
- By 2050
- 60,442 · +6.3%
- By 2075
- 59,211 · +4.1%
- By 2100
- 55,326 · -2.7%
Race, ethnicity, and origin ACS 2023
- Neighborhood character
- Predominantly White (88%)
- Race & ethnicity
- White 88% Two or more races 7% Hispanic / Latino 6%
- Hispanic origin (detail)
- Mexican 5%
- Common ancestry
- Slovak 4% Serbian 4% Lithuanian 3%
- Foreign-born
- 3% · Canada
- Languages at home
- 95% English-only · Spanish 5%
Political lean MEDSL · Jefferson
- 2024 margin
- Solid R (+64.2) · D 17.4% · R 81.6%
- 2008→2024 swing
- -21.5pp toward R · 2008: -42.7pp · 2024: -64.2pp
- All cycles
- 2024: R+64.2 2020: R+59.3 2016: R+59.3 2012: R+50.1 2008: R+42.7
Not yet ingested
- Civics
- —
Market trends
- HPI YoY
- ▲ 8.61%
- Current HPI
- 325.66
- Rent YoY
- —
- Metro
- —
- State GDP YoY
- ▲ 2.78%
- F500 in state
- 22
Industry mix (Fortune 500 HQ in TN)
| Industry | F500 HQs | Revenue |
|---|---|---|
| Healthcare | 3 | $91B |
|
||
| Retail | 3 | $72B |
|
||
| Transportation / Logistics | 1 | $88B |
|
||
| Paper / Packaging | 1 | $19B |
|
||
| Insurance | 1 | $13B |
|
||
| Energy | 1 | $12B |
|
||
Price history
+513.2% since first listed2 events — show timeline
- 2026-06-01 Listed $199,900 Knoxville MLS
- 1981-01-06 Sold (Public Records) $32,600 Public Records
Property tax history
+5.1%/yrLatest (2025): $847 · +4.2% YoY. Source: county tax records.
Cash-flow waterfall
monthlySold comps — $/sqft
last 12 mo · ≤1 miLoading sold comps…