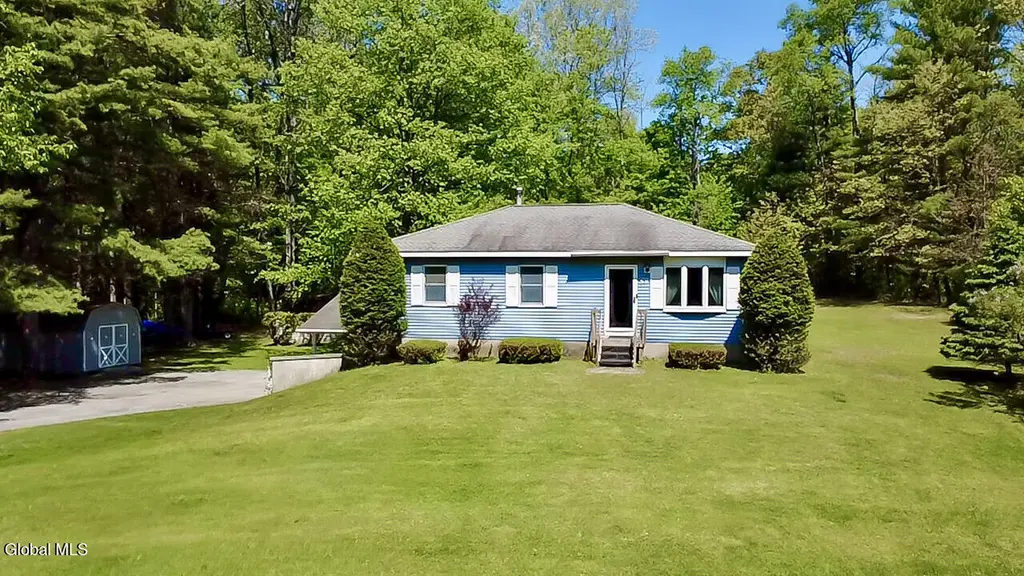
59 Daketown Rd
Saratoga Springs, NY 12833
$319,900D
3 bd · 1.5 ba ·
1,176 sqft ·
Built 1994
· SingleFamily
· Pending
· 4 DOM
Cashflow @ list (25.0% down · 7.5%)
Estimated rent
$1,943/mo
Mortgage (P&I)
−$1,678
Tax + insurance
−$402
HOA
−$0
Vac / Maint / Mgmt
−$408
Net cashflow
$-545/mo
Annual
$-6,537/yr
Cap rate
4.25%
Cash-on-cash
-7.30%
DSCR
0.68
1% rule
0.61%
Cash to close
$89,572
Investor read
- This is a 3-bed/1.5-bath single-family listed at $320k.
- At list price, monthly cash flow is $-545 ($-7k/yr) — negative.
- To cash-flow at today's rent, offer at most $224k (30.1% below list).
- To meet the 1% rule (rent ≥ 1% of price), the offer needs to be $194k (39.3% below list).
- Only 4 days on market — expect competitive offers; lowballing is unlikely to land.
- Recommended offer: $194k (39.3% below list) — sets the bar for 1% rule.
- In year one you build about $30k of equity ($2k loan paydown + $28k appreciation (8.7% local appreciation)).
- Location reads 82/100 on livability (#83 in NY, #1,284 nationally) — a professional / high-income tenant draw. Strengths: employment A+, housing A+, health & safety A; Watch: amenities D+, cost of living F.
- Saratoga Springs City SD (suburban): math 67% / reading 72% proficiency, ranked #138 of 590 in NY (top 23%) — acceptable for families but not a draw, mixed tenant base, ~2y average lease; only 15% free/reduced lunch — higher-income household profile.
- Zoned schools: Greenfield Elementary School (math 72% / reading 77%, grade A, #314 of 2,108 statewide, top 17%, 406 students, 36% FRL); Saratoga Springs High School (math 98% / reading 92%, grade A+, #83 of 1,100 statewide, top 8%, 1,947 students, 26% FRL) — zoned schools average 31% FRL vs 15% district-wide (16 pts higher); higher-poverty schools than district average — tighter screening recommended.
- Zoned-school proficiency averages 85% at this address vs 70% district-wide (+15 pts) — the actual schools serving this property are materially stronger than the Saratoga Springs City SD average implies; a family-tenant draw the district grade alone would hide.
- Market conditions: 47 active listings in the ZIP; 1,132 units permitted in Saratoga County in 2024 (378 in 5+ unit buildings).
- Saratoga County population projected at +4% by 2050 — modest demand growth; plan on rents tracking national, not racing it.
- By year 2, paydown + projected appreciation supports a ~$48k cash-out refi (75% LTV) — recoverable capital for the next deal without selling this one.
- Cap rate 4.2% vs local median 2.0% in Saratoga Springs — top-decile yield for the area; either an underpriced asset or a hidden risk that comps aren't pricing in. Stress-test before assuming the spread holds.
Questions for listing agent
- What do current leases actually rent for vs. the listed asking? Can we see a recent rent roll and the last 12 months of T-12 income?
- Is there a deadline driving the sale (1031 exchange, divorce, estate, relocation)? That informs how much negotiation room exists.
- Schools are A-rated — typically a magnet for longer-tenancy family renters. What's the average tenant stay here, and is there a school-zone premium baked into asking?
- The area grade is low — what's the realistic commute time and amenity access for the typical tenant pool here? Any planned neighborhood developments (good or bad) we should know about?
- What's the average days-on-market for RENTAL listings here right now (not sales)? A rising rental-DOM trend means longer vacancies and softer asking-rent achievability than the comps imply.
- What's the recent tenant-quality profile in this submarket — average credit score on applications, eviction rate, late-payment / NSF rate, and stable-employment percentage? A property-management company in the area should have these aggregated.
- How much new for-sale + rental construction is in the pipeline within 1–3 miles? Heavy new supply typically softens prices + rents 12–24 months out; constrained supply supports both.
CashFlowRE · CFR-RB97ZQ4KDHM9TA
· Data 2 weeks ago
cashflowre.app · 2026-05-29