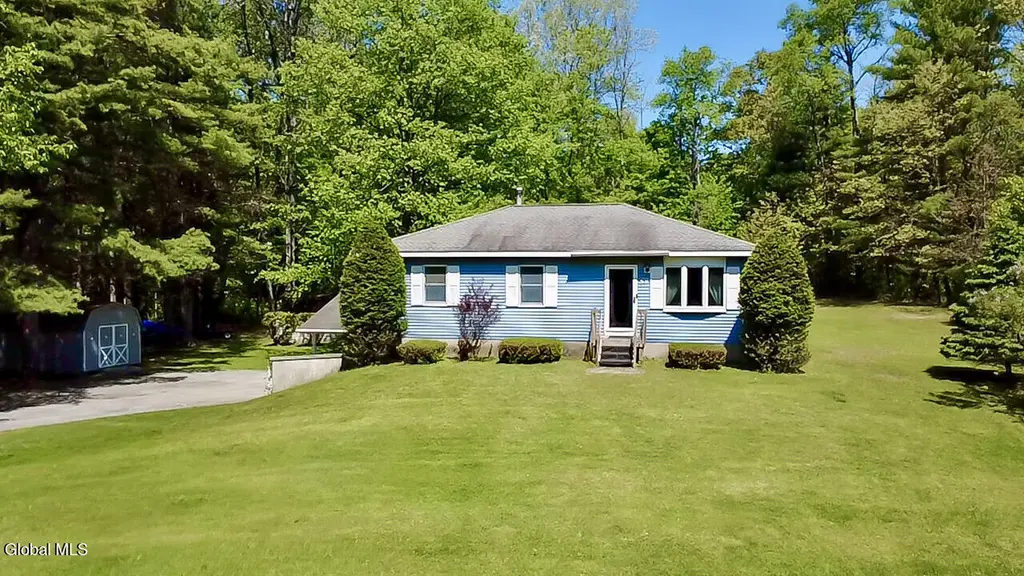
59 Daketown Rd · Saratoga Springs, NY
Flood risk 1/10 · Minimal
- FEMA flood zone
- X
- Chance of flooding over 30 yrs
- 0.0%
- Est. flood insurance / yr
- $473 – $860
Fire risk 2/10 · Minimal
- Est. fire insurance / yr
- $691 – $1,283
Heat risk 2/10 · Minimal
- Hot days now (above 95°F)
- 7 days/yr
- Hot days in 30 yrs
- 16 days/yr
Wind risk 2/10 · Minimal
- Chance of severe wind over 30 yrs
- 3.0%
Air-quality risk 1/10 · Minimal
- Unhealthy air days now
- 0 days/yr
- Unhealthy air days in 30 yrs
- 0 days/yr
Risk factors via First Street. Map © Google.
Why this score? — see what drove the D grade
The composite is a weighted blend of 9 inputs, each scored 0–100. Each bar is that input's sub-score; the figure is the points it added to the 100-point composite (weight × sub-score).
- Appreciation +9.3/10.0
- ARV discount +7.5/15.0
- Cash flow +6.5/30.0
- Schools +6.1/10.0
- Livability +4.1/5.0
- Rent growth +2.5/5.0
- Condition / age +2.5/5.0
- 1% rule +1.1/10.0
- DSCR +0.8/10.0
$319,900
🖨 Deal sheet 📄 Offer letter ✓ Due diligence
Listing remarks
Charming 3 BR, 1.5 BA ranch-style home located in desirable Greenfield Center within the Saratoga School District. Nestled on a quiet road, this home offers the perfect balance of privacy and convenience. Situated on a beautiful 1-acre lot surrounded by mature trees, you'll enjoy peaceful living with plenty of space to relax. A beautiful 3-season sunroom provides the perfect spot to enjoy morning coffee or take in the peaceful backyard views and features a propane stove to help keep the space warm and comfortable during the cooler months. The heated basement and heated 2-car garage add year-round comfort and functionality, while the 3 sheds on the property provide ample add'l storage space.
Key facts
- Propane stove
- Heated basement
- Ranch-style home
Tags
Property features AI
Exterior
- Parking: Under-residence parking; Detached or attached 2-car garage with heated space and garage door opener; Paved driveway; Total parking for 10 vehicles
- Utilities: Electric with circuit breakers and generator; Septic tank
- Home design: Single-family residence; One-story main level with basement; Vinyl siding; Asphalt roof; Concrete perimeter foundation; Property faces with 143' main road frontage on a 1-acre lot
- Construction: Vinyl siding construction; Asphalt roof; Concrete perimeter foundation
- Exterior features: Enclosed rear porch (three-season); Paved driveway and exterior lighting; Shed(s) on property; Road frontage and wooded lot
Interior
- Kitchen: Dishwasher; Electric oven; Range; Range hood; Microwave; Refrigerator; Electric water heater
- Bedrooms: Three first-floor bedrooms
- Flooring: Carpet; Hardwood; Linoleum
- Bathrooms: One full bathroom on the first floor; One half bathroom on the first floor
- Heating & cooling: Forced-air heating (oil and propane); Central air conditioning; Attic fan
- Interior features: High-speed internet; Ceiling paddle fan; Walk-in closet(s); Atrium door, sliding doors and storm door(s); Window coverings include screens, shutters, blinds and curtain rods; Finished, heated basement with both interior and exterior entry; One fireplace
- Laundry & utility: Laundry in basement; Fuel tank(s) present
Neighborhood map
What this means for you Summary
Snapshot
- This is a 3-bed/1.5-bath single-family listed at $320k.
Deal economics
- At list price, monthly cash flow is $-545 ($-7k/yr) — negative.
- To cash-flow at today's rent, offer at most $224k (30.1% below list).
- To meet the 1% rule (rent ≥ 1% of price), the offer needs to be $194k (39.3% below list).
- Recommended offer: $194k (39.3% below list) — sets the bar for 1% rule.
- Cap rate 4.2% vs local median 2.0% in Saratoga Springs — top-decile yield for the area; either an underpriced asset or a hidden risk that comps aren't pricing in. Stress-test before assuming the spread holds.
Location & tenants
- Location reads 82/100 on livability (#83 in NY, #1,284 nationally) — a professional / high-income tenant draw. Strengths: employment A+, housing A+, health & safety A; Watch: amenities D+, cost of living F.
- Saratoga Springs City SD (suburban): math 67% / reading 72% proficiency, ranked #138 of 590 in NY (top 23%) — acceptable for families but not a draw, mixed tenant base, ~2y average lease; only 15% free/reduced lunch — higher-income household profile.
- Zoned schools: Greenfield Elementary School (math 72% / reading 77%, grade A, #314 of 2,108 statewide, top 17%, 406 students, 36% FRL); Saratoga Springs High School (math 98% / reading 92%, grade A+, #83 of 1,100 statewide, top 8%, 1,947 students, 26% FRL) — zoned schools average 31% FRL vs 15% district-wide (16 pts higher); higher-poverty schools than district average — tighter screening recommended.
- Zoned-school proficiency averages 85% at this address vs 70% district-wide (+15 pts) — the actual schools serving this property are materially stronger than the Saratoga Springs City SD average implies; a family-tenant draw the district grade alone would hide.
- Market conditions: 47 active listings in the ZIP; 1,132 units permitted in Saratoga County in 2024 (378 in 5+ unit buildings).
Forward outlook
- In year one you build about $30k of equity ($2k loan paydown + $28k appreciation (8.7% local appreciation)).
- Saratoga County population projected at +4% by 2050 — modest demand growth; plan on rents tracking national, not racing it.
- By year 2, paydown + projected appreciation supports a ~$48k cash-out refi (75% LTV) — recoverable capital for the next deal without selling this one.
Negotiation context
- Only 4 days on market — expect competitive offers; lowballing is unlikely to land.
Questions for the listing agent
- What do current leases actually rent for vs. the listed asking? Can we see a recent rent roll and the last 12 months of T-12 income?
- Is there a deadline driving the sale (1031 exchange, divorce, estate, relocation)? That informs how much negotiation room exists.
- Schools are A-rated — typically a magnet for longer-tenancy family renters. What's the average tenant stay here, and is there a school-zone premium baked into asking?
- The area grade is low — what's the realistic commute time and amenity access for the typical tenant pool here? Any planned neighborhood developments (good or bad) we should know about?
- What's the average days-on-market for RENTAL listings here right now (not sales)? A rising rental-DOM trend means longer vacancies and softer asking-rent achievability than the comps imply.
- What's the recent tenant-quality profile in this submarket — average credit score on applications, eviction rate, late-payment / NSF rate, and stable-employment percentage? A property-management company in the area should have these aggregated.
- How much new for-sale + rental construction is in the pipeline within 1–3 miles? Heavy new supply typically softens prices + rents 12–24 months out; constrained supply supports both.
Investment metrics
- 1% rule
- 0.61% ✗
- Cap rate
- 4.25%
- Cash-on-cash
- -7.30%
- DSCR
- 0.68
- GRM
- 13.7
CMA / ARV
No comps found within radius.
Projected returns pro-forma
8.69% appreciation · 3.0% rent growth · sell at horizon
- IRR
- 16.1%
- Equity multiple
- 2.24×
- Total profit
- $111,375
- Equity at exit
- $258,293
- IRR
- 15.5%
- Equity multiple
- 4.91×
- Total profit
- $350,029
- Equity at exit
- $527,988
Cash invested: $89,572 (down + closing). Projections, not guarantees.
Landlord ↔ Tenant lean methodology
- Overall (STATE)
- 15 Strongly Tenant-Friendly
- State New York
- 15 Strongly Tenant-Friendly · D+10
- County
- — inherits STATE
- City
- — inherits STATE
ZIP-level market 12833
- Home prices YoY
- 2.6%
- Active inventory
- 47
- Price-to-rent
- 13.7×
Monthly cashflow live
- Estimated rent
- $1,943 medium interval (Pro) →
- Mortgage (P&I)
- −$1,678
- Tax from tax record
- −$269 /mo · $3,224/yr
- Insurance
- −$133
- HOA
- −$0
- Vacancy / Maint / Mgmt
- −$408
- Net cashflow
- $-545
Break-even live
UW: 25.0% down · 7.5% · 30yr · 1.5% tax · 5.0% vac · 8.0% maint · 8.0% mgmt
Financing live
Cash to close
- Down payment
- $79,975
- Closing costs
- $9,597
- Reserves months
- —
- Total cash needed
- —
Loan-product check · same deal, 3 products live
Conventional
25% down · 7.5% · 30yr
- Down + closing
- —
- Monthly P&I
- —
- Monthly cashflow
- —
- DSCR
- —
- Eligible?
- —
Personal DTI + credit; lowest rate.
DSCR
20% down · 8.5% · 30yr
- Down + closing
- —
- Monthly P&I
- —
- Monthly cashflow
- —
- DSCR
- —
- Eligible?
- —
No personal income docs; deal must DSCR.
Hard money
10% down · 12.0% · 12mo
- Down + closing
- —
- Monthly P&I
- —
- Monthly cashflow
- —
- DSCR
- —
- Eligible?
- —
Short-term bridge; refi at stabilization.
Listing history 5 events
-
2026-06-03status $319,900 Pending 4 DOM
-
2026-06-02days on market $319,900 Active 4 DOM
-
2026-06-01days on market $319,900 Active 3 DOM
-
2026-05-31days on market $319,900 Active 2 DOM
-
2026-05-29$319,900 Active
ⓘ Source: listings_history table (triggers on properties + properties_extension) + one-shot
backfill from property_details.listing_events for pre-trigger history.
Tax reassessment forecast NY · Partial reset (capped growth)
- Current annual tax
- $3,224 · $269/mo
- Projected year-2 tax
- $4,315 · $360/mo
- Expected delta
- +$1,091/yr (+$91/mo · 33.8%)
ⓘ Screening estimate from a state-policy table — verify with the county assessor before closing.
Climate risk First Street
- Flood 1/10 Low FEMA zone X · 0% chance over 30 yrs
- Wildfire 2/10 Low
- Heat 2/10 Low 7 d/yr ≥95°F today · 16 d/yr by 30 yrs out
- Wind 2/10 Low 3% chance of damaging wind over 30 yrs
- Air quality 1/10 Low 0 unhealthy d/yr today · 0 by 30 yrs out
Nearby sold comps map
Loading sold comps map…
Walkable amenities ~0.75 mi
Loading nearby amenities…
Taxation est. · year 1
- Rental income
- $23,313
- − Mortgage interest
- −$17,919
- − Property taxes
- −$3,224
- − Insurance
- −$1,600
- − Repairs & maintenance
- −$1,865
- − Management
- −$1,865
- − Depreciation
- −$9,306
- Taxable loss
- −$12,466
- Est. tax savings @ 24.0%
- +$2,992
- After-tax cash flow
- $-3,545/yr
For passive investors: Depreciation is non-cash, so a rental often shows a tax loss while cash-flowing — sheltering income. Rental losses are passive: they offset passive income freely, and up to $25,000/yr can offset ordinary (W-2) income if you actively participate and your MAGI is under $100k (phasing out to $0 by $150k); unused losses carry forward. On sale, claimed depreciation is recaptured at up to 25%, and gains may owe capital-gains tax (a 1031 exchange can defer both). Figures are a year-1 estimate at your 24.0% rate — not tax advice; consult a CPA.
Schools (NCES district)
- District
- Saratoga Springs City SD
- NCES district ID
- 3625770
- Math proficiency
- 67% ▼ -10.00%
- Reading proficiency
- 72% ▲ 6.00%
- Median HH income
- $69,864
- Composite
- 60.83/100
- National rank
- #818
- State rank
- #138 of 590 in NY
Livability — Saratoga Springs
- Score
- 82/100
- State rank
- #83
- US rank
- #1284
Category grades
Schools grade is shown separately in the Schools card above.
Census & demographics
- City population
- 40,057
- Population (ZIP)
- 5,368
Population outlook (Saratoga County) Hauer SSP2
- Today (2025)
- 238,889 people
- By 2030
- 243,681 · +2.0%
- By 2040
- 249,118 · +4.3%
- By 2050
- 248,638 · +4.1%
- By 2075
- 241,675 · +1.2%
- By 2100
- 213,150 · -10.8%
Race, ethnicity, and origin ACS 2023
- Neighborhood character
- Predominantly White (93%)
- Race & ethnicity
- White 93% Two or more races 3% Asian 1% Hispanic / Latino 1%
- Common ancestry
- Romanian 7% Lithuanian 3% Slovak 3%
- Foreign-born
- 6% · Canada
Political lean MEDSL · Saratoga
- 2024 margin
- Toss-up / Even · D 50.9% · R 49.1%
- 2008→2024 swing
- -1.6pp toward R · 2008: 3.4pp · 2024: 1.8pp
- All cycles
- 2024: D+1.8 2020: D+5.4 2016: R+4.4 2012: D+2.1 2008: D+3.4
Not yet ingested
- Civics
- —
Market trends
- HPI YoY
- ▲ 8.69%
- Current HPI
- 347.631
- Rent YoY
- —
- Metro
- —
- State GDP YoY
- ▲ 2.60%
- F500 in state
- 92
Industry mix (Fortune 500 HQ in NY)
| Industry | F500 HQs | Revenue |
|---|---|---|
| Financial Services | 10 | $950B |
|
||
| Consumer Goods | 9 | $162B |
|
||
| Insurance | 4 | $225B |
|
||
| Telecommunications | 2 | $144B |
|
||
| Pharmaceuticals | 2 | $112B |
|
||
| Media / Entertainment | 2 | $69B |
|
||
Price history
1 event — show timeline
- 2026-05-29 Listed $319,900 Global MLS
Property tax history
+16.8%/yrLatest (2025): $3,224 · -4.6% YoY. Source: county tax records.
Cash-flow waterfall
monthlySold comps — $/sqft
last 12 mo · ≤1 miLoading sold comps…