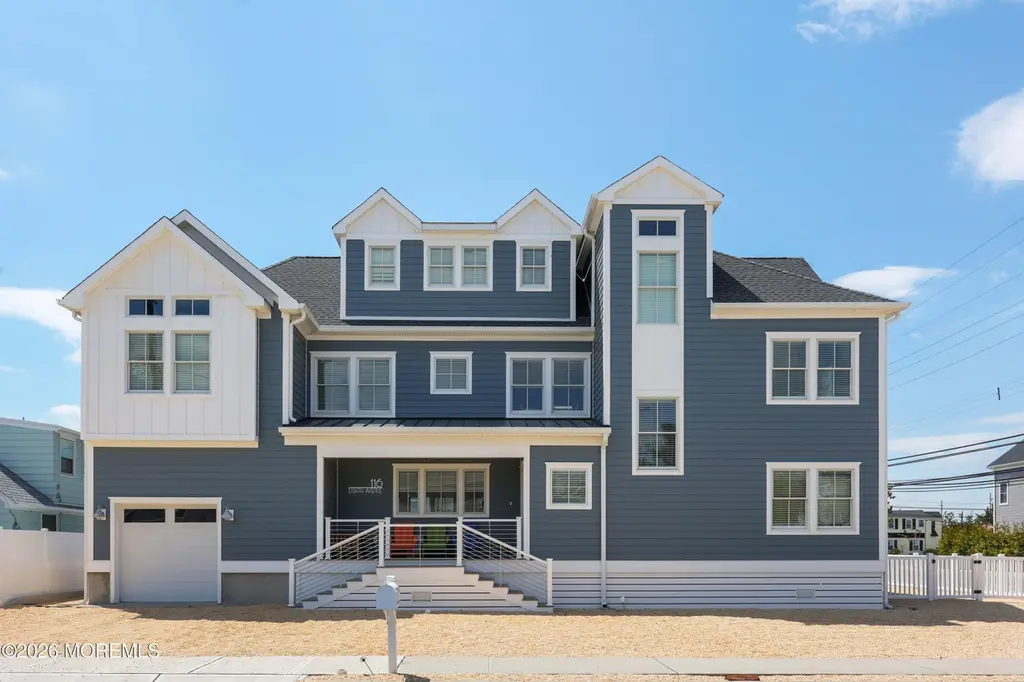
116 8th Ave
Dover Beaches North, NJ 08739
$3,190,000D-
7 bd · 6.0 ba ·
3,939 sqft ·
Built 2024
· SingleFamily
· Active
· 40 DOM
Cashflow @ list (25.0% down · 7.5%)
Estimated rent
$15,940/mo
Mortgage (P&I)
−$16,729
Tax + insurance
−$3,450
HOA
−$44
Vac / Maint / Mgmt
−$3,347
Net cashflow
$-7,630/mo
Annual
$-91,562/yr
Cap rate
3.47%
Cash-on-cash
-10.09%
DSCR
0.55
1% rule
0.50%
Cash to close
$893,200
Investor read
- This is a 7-bed/6.0-bath single-family listed at $3.19M.
- At list price, monthly cash flow is $-8k ($-92k/yr) — negative.
- To cash-flow at today's rent, offer at most $1.84M (42.3% below list).
- To meet the 1% rule (rent ≥ 1% of price), the offer needs to be $1.59M (50.0% below list).
- It's been on market 40 days — a 3% lower offer ($3.09M) is reasonable based on typical stale-listing flexibility.
- Recommended offer: $1.59M (50.0% below list) — sets the bar for 1% rule.
- In year one you build about $180k of equity ($22k loan paydown + $158k appreciation (4.9% local appreciation)).
- Location reads 51/100 on livability (#534 in NJ) — a working-class tenant base; expect higher turnover. Strengths: crime A+; Watch: schools C-, employment D+, amenities F.
- Brick Township Public School District (suburban): math 18% / reading 43% proficiency, ranked #330 of 472 in NJ (top 70%) — families likely to look elsewhere, expect single-tenant / working-renter base with shorter leases.
- Watch-outs: flood insurance adds $122/mo.
- Market conditions: 6 active listings in the ZIP; 3 comparable units currently listed for rent nearby; rentals leasing fast (median 8d on market — plan ~1-2 weeks tenant-placement turnaround); 4,434 units permitted in Ocean County in 2024 (868 in 5+ unit buildings).
- Ocean County population projected to shrink 8% by 2050 — rents likely to lag national; underwrite the cash flow, not the appreciation.
- By year 2, paydown + projected appreciation supports a ~$288k cash-out refi (75% LTV) — recoverable capital for the next deal without selling this one.
- Climate carrying-cost: in FEMA flood zone AO (mandatory federal flood insurance); severe wind risk, 80% chance of damaging wind over 30y; extreme-heat days projected 7→15/yr by 2055 (HVAC capex compounding) — expect insurance premiums to compound above CPI over the hold.
- Cap rate 3.5% vs local median 1.5% in Dover Beaches North — top-decile yield for the area; either an underpriced asset or a hidden risk that comps aren't pricing in. Stress-test before assuming the spread holds.
Questions for listing agent
- What do current leases actually rent for vs. the listed asking? Can we see a recent rent roll and the last 12 months of T-12 income?
- It's been on market 40 days. Have you received any prior offers? Is the seller open to a 50% concession, seller financing, or rate buy-down credit?
- What's the actual annual flood-insurance premium (NFIP or private), and is the property in a SFHA with mandatory coverage?
- What does the HOA fee cover, when was the last increase, and are there any pending special assessments or reserve-fund shortfalls?
- Is there a deadline driving the sale (1031 exchange, divorce, estate, relocation)? That informs how much negotiation room exists.
- The area grade is low — what's the realistic commute time and amenity access for the typical tenant pool here? Any planned neighborhood developments (good or bad) we should know about?
- What's the average days-on-market for RENTAL listings here right now (not sales)? A rising rental-DOM trend means longer vacancies and softer asking-rent achievability than the comps imply.
- What's the recent tenant-quality profile in this submarket — average credit score on applications, eviction rate, late-payment / NSF rate, and stable-employment percentage? A property-management company in the area should have these aggregated.
CashFlowRE · CFR-RBABT6317JGRCC
· Data 1 day ago
cashflowre.app · 2026-05-29