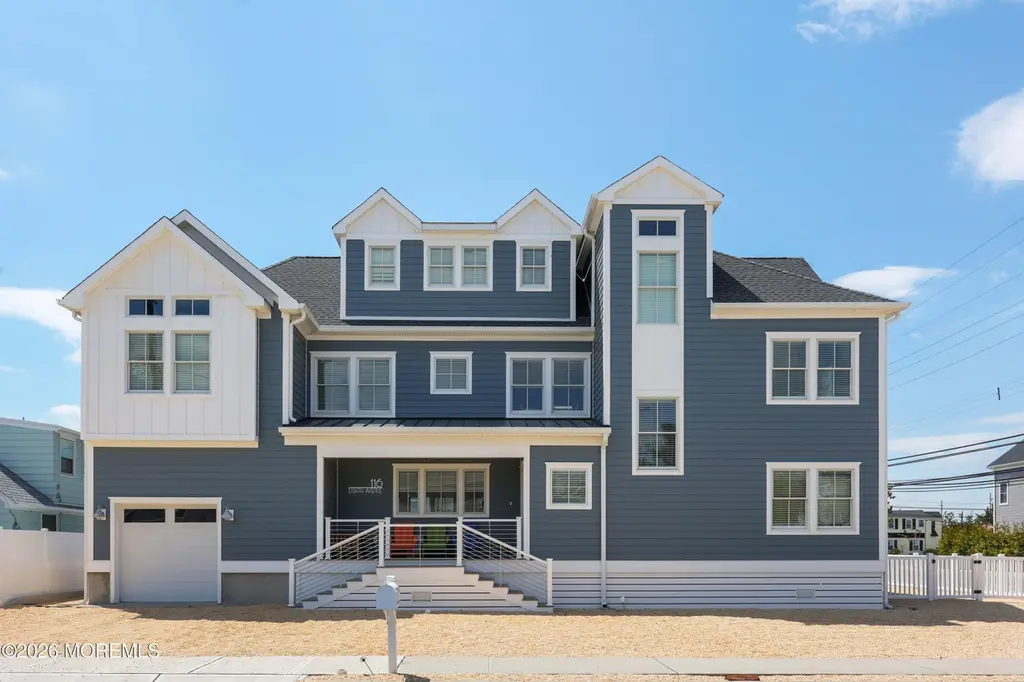
116 8th Ave · Dover Beaches North, NJ
Flood risk 8/10 · Major
- FEMA flood zone
- AO
- Chance of flooding over 30 yrs
- 0.99%
- Est. flood insurance / yr
- $848 – $2,087
Fire risk 1/10 · Minimal
- Est. fire insurance / yr
- $526 – $976
Heat risk 8/10 · Major
- Hot days now (above 95°F)
- 7 days/yr
- Hot days in 30 yrs
- 15 days/yr
Wind risk 8/10 · Major
- Chance of severe wind over 30 yrs
- 80.0%
Air-quality risk 3/10 · Minor
- Unhealthy air days now
- 3 days/yr
- Unhealthy air days in 30 yrs
- 4 days/yr
Risk factors via First Street. Map © Google.
Why this score? — see what drove the D- grade
The composite is a weighted blend of 9 inputs, each scored 0–100. Each bar is that input's sub-score; the figure is the points it added to the 100-point composite (weight × sub-score).
- ARV discount +15.0/15.0
- Appreciation +7.5/10.0
- Cash flow +5.0/30.0
- Schools +2.8/10.0
- Livability +2.6/5.0
- Rent growth +2.5/5.0
- Condition / age +2.5/5.0
- 1% rule +0.0/10.0
- DSCR +0.0/10.0
$3,190,000
🖨 Deal sheet 📄 Offer letter ✓ Due diligence
Listing remarks
Welcome to Jersey Shore luxury at its finest in the highly sought-after Normandy Beach! Built in 2024, this custom 4,200 sq ft beachside home offers the perfect blend of space, design, and coastal lifestyle--just steps from the beach. The first floor showcases an open-concept layout featuring a gourmet kitchen with expansive pantry, spacious dining area, and a stunning living room with a gas see-through fireplace that connects to a cozy sitting room. A first-floor bedroom, full bath, and additional half bath provide flexibility for guests or extended family. The second floor offers 5 generously sized bedrooms, including a primary suite with private ensuite bath, plus two Jack & Jill b
Key facts
- First-floor bedroom
- Gourmet kitchen
- Private ensuite
Tags
Property features AI
Finance
- Other: Living area approximately 4200; Located in Normandy Beach subdivision, Mantoloking, Ocean County
- HOA & community: Part of Normandy Beach Improvement Association; Annual association fee of $525
Exterior
- Parking: Attached garage (1 car)
- Utilities: Public sewer
- Home design: Custom model; Fee simple ownership
- Construction: Crawl space basement (unfinished/other)
- Exterior features: Shingle roof; Insulated windows; Oceanside/beach block location; Level lot
Interior
- Kitchen: Gas cooking; Stove; Microwave; Dishwasher; Garbage disposal; Refrigerator; Freezer
- Bedrooms: 7 bedrooms (mix of first, second and third level bedrooms)
- Bathrooms: 5 full bathrooms; 1 half bathroom
- Heating & cooling: Forced air heating with 3+ zoned heat; Central air conditioning with 3+ zoned AC; Other cooling
- Interior features: Ceiling fans; Fireplace (1); Washer and dryer included; Blinds/shades; Light fixtures; Outdoor lighting; Garage door opener; Generator; Pantry; Mudroom; Study; Bonus room; Other finished/usable rooms
- Laundry & utility: Laundry room (second level); Washer; Dryer
Neighborhood map
What this means for you Summary
Snapshot
- This is a 7-bed/6.0-bath single-family listed at $3.19M.
Deal economics
- At list price, monthly cash flow is $-8k ($-92k/yr) — negative.
- To cash-flow at today's rent, offer at most $1.84M (42.3% below list).
- To meet the 1% rule (rent ≥ 1% of price), the offer needs to be $1.59M (50.0% below list).
- Recommended offer: $1.59M (50.0% below list) — sets the bar for 1% rule.
- Cap rate 3.5% vs local median 1.5% in Dover Beaches North — top-decile yield for the area; either an underpriced asset or a hidden risk that comps aren't pricing in. Stress-test before assuming the spread holds.
Location & tenants
- Location reads 51/100 on livability (#534 in NJ) — a working-class tenant base; expect higher turnover. Strengths: crime A+; Watch: schools C-, employment D+, amenities F.
- Brick Township Public School District (suburban): math 18% / reading 43% proficiency, ranked #330 of 472 in NJ (top 70%) — families likely to look elsewhere, expect single-tenant / working-renter base with shorter leases.
- Market conditions: 6 active listings in the ZIP; 3 comparable units currently listed for rent nearby; rentals leasing fast (median 7d on market — plan ~1-2 weeks tenant-placement turnaround); 4,434 units permitted in Ocean County in 2024 (868 in 5+ unit buildings).
Forward outlook
- In year one you build about $180k of equity ($22k loan paydown + $158k appreciation (4.9% local appreciation)).
- Ocean County population projected to shrink 8% by 2050 — rents likely to lag national; underwrite the cash flow, not the appreciation.
- By year 2, paydown + projected appreciation supports a ~$288k cash-out refi (75% LTV) — recoverable capital for the next deal without selling this one.
Negotiation context
- It's been on market 40 days — a 3% lower offer ($3.09M) is reasonable based on typical stale-listing flexibility.
Risks & watch-outs
- Watch-outs: flood insurance adds $122/mo.
- Climate carrying-cost: in FEMA flood zone AO (mandatory federal flood insurance); severe wind risk, 80% chance of damaging wind over 30y; extreme-heat days projected 7→15/yr by 2055 (HVAC capex compounding) — expect insurance premiums to compound above CPI over the hold.
Questions for the listing agent
- What do current leases actually rent for vs. the listed asking? Can we see a recent rent roll and the last 12 months of T-12 income?
- It's been on market 40 days. Have you received any prior offers? Is the seller open to a 50% concession, seller financing, or rate buy-down credit?
- What's the actual annual flood-insurance premium (NFIP or private), and is the property in a SFHA with mandatory coverage?
- What does the HOA fee cover, when was the last increase, and are there any pending special assessments or reserve-fund shortfalls?
- Is there a deadline driving the sale (1031 exchange, divorce, estate, relocation)? That informs how much negotiation room exists.
- The area grade is low — what's the realistic commute time and amenity access for the typical tenant pool here? Any planned neighborhood developments (good or bad) we should know about?
- What's the average days-on-market for RENTAL listings here right now (not sales)? A rising rental-DOM trend means longer vacancies and softer asking-rent achievability than the comps imply.
- What's the recent tenant-quality profile in this submarket — average credit score on applications, eviction rate, late-payment / NSF rate, and stable-employment percentage? A property-management company in the area should have these aggregated.
- How much new for-sale + rental construction is in the pipeline within 1–3 miles? Heavy new supply typically softens prices + rents 12–24 months out; constrained supply supports both.
Investment metrics
- 1% rule
- 0.50% ✗
- Cap rate
- 3.47%
- Cash-on-cash
- -10.09%
- DSCR
- 0.55
- GRM
- 16.7
CMA / ARV
- ARV (median comp)
- $3,844,690
- List price
- $3,190,000
- Delta
- -17.03%
- Verdict
- UNDERPRICED
- Comps
- 18 within 1.0 mi
Show comp detail 2 sales within ~0.75 mi
| Address | Dist | Beds/Ba | Sqft | Sold | Price | $/sf | Match |
|---|---|---|---|---|---|---|---|
| 29 4th Ave | 0.20mi | 7/4.5 | 3,861 (-2%) | 22mo | $1,854,200 | $480 | 63 |
| 520 Normandy Dr | 0.32mi | 6/5.0 (-1) | 4,250 (+8%) | 23mo | $4,999,999 | $1,176 | 44 |
Match score weights: distance 35% · size 25% · config 20% · recency 20%. Top-matched comps best support the ARV.
Projected returns pro-forma
4.94% appreciation · 3.0% rent growth · sell at horizon
- IRR
- 4.1%
- Equity multiple
- 1.27×
- Total profit
- $238,026
- Equity at exit
- $1,796,693
- IRR
- 6.8%
- Equity multiple
- 2.28×
- Total profit
- $1,143,597
- Equity at exit
- $3,091,760
Cash invested: $893,200 (down + closing). Projections, not guarantees.
Landlord ↔ Tenant lean methodology
- Overall (STATE)
- 21 Tenant-Leaning
- State New Jersey
- 21 Tenant-Leaning · D+6
- County
- — inherits STATE
- City
- — inherits STATE
ZIP-level market 08739
- Home prices YoY
- 2.3%
- Active inventory
- 6
- Price-to-rent
- 16.7×
Monthly cashflow live
- Estimated rent
- $15,940 medium interval (Pro) →
- Mortgage (P&I)
- −$16,729
- Tax from tax record
- −$1,999 /mo · $23,986/yr
- Insurance
- −$1,329
- Flood insurance flood zone
- −$122 /mo · $1,468/yr
- HOA
- −$44
- Vacancy / Maint / Mgmt
- −$3,347
- Net cashflow
- $-7,630
Break-even live
UW: 25.0% down · 7.5% · 30yr · 1.5% tax · 5.0% vac · 8.0% maint · 8.0% mgmt
Financing live
Cash to close
- Down payment
- $797,500
- Closing costs
- $95,700
- Reserves months
- —
- Total cash needed
- —
Loan-product check · same deal, 3 products live
Conventional
25% down · 7.5% · 30yr
- Down + closing
- —
- Monthly P&I
- —
- Monthly cashflow
- —
- DSCR
- —
- Eligible?
- —
Personal DTI + credit; lowest rate.
DSCR
20% down · 8.5% · 30yr
- Down + closing
- —
- Monthly P&I
- —
- Monthly cashflow
- —
- DSCR
- —
- Eligible?
- —
No personal income docs; deal must DSCR.
Hard money
10% down · 12.0% · 12mo
- Down + closing
- —
- Monthly P&I
- —
- Monthly cashflow
- —
- DSCR
- —
- Eligible?
- —
Short-term bridge; refi at stabilization.
Rent comps 3 comps
| Address | Beds | Baths | Sqft | Rent | $/sqft | DOM | Units | Dist |
|---|---|---|---|---|---|---|---|---|
| 535 Highway 35 N Mantoloking, NJ | 6.0 | 5.0 | 3948 | $16,000 | $4.05 | 24d | 1 | 0.05mi |
| 29 4th Ave Lavallette, NJ | 7.0 | 4.5 | 3861 | $13,000 | $3.37 | 7d | 1 | 0.19mi |
| 520 Normandy Dr Unit WKLY SUMMER RENTAL Mantoloking, NJ | 6.0 | 4.5 | 5000 | $22,000 | $4.40 | 1d | 1 | 0.33mi |
HOA detail
- Monthly dues
- $44 · $528/yr
- Likely covers
- gas
Listing history 15 events
-
2026-06-18days on market $3,190,000 Active 40 DOM
-
2026-06-17days on market $3,190,000 Active 39 DOM
-
2026-06-16days on market $3,190,000 Active 38 DOM
-
2026-06-15days on market $3,190,000 Active 37 DOM
-
2026-06-13days on market $3,190,000 Active 35 DOM
-
2026-06-13days on market $3,190,000 Active 34 DOM
-
2026-06-09days on market $3,190,000 Active 31 DOM
-
2026-06-08days on market $3,190,000 Active 30 DOM
-
2026-06-07days on market $3,190,000 Active 29 DOM
-
2026-06-04days on market $3,190,000 Active 26 DOM
-
2026-06-03days on market $3,190,000 Active 25 DOM
-
2026-06-02days on market $3,190,000 Active 24 DOM
-
2026-06-01days on market $3,190,000 Active 23 DOM
-
2026-05-31days on market $3,190,000 Active 22 DOM
-
2026-05-08$3,499,999 Active 1357-char remark
ⓘ Source: listings_history table (triggers on properties + properties_extension) + one-shot
backfill from property_details.listing_events for pre-trigger history.
Tax reassessment forecast NJ · Partial reset (capped growth)
- Current annual tax
- $23,986 · $1,999/mo
- Projected year-2 tax
- $51,709 · $4,309/mo
- Expected delta
- +$27,722/yr (+$2,310/mo · 115.6%)
ⓘ Screening estimate from a state-policy table — verify with the county assessor before closing.
Climate risk First Street
- Flood 8/10 Severe FEMA zone AO · 99% chance over 30 yrs
- Wildfire 1/10 Low
- Heat 8/10 Severe 7 d/yr ≥95°F today · 15 d/yr by 30 yrs out
- Wind 8/10 Severe 80% chance of damaging wind over 30 yrs
- Air quality 3/10 Moderate 3 unhealthy d/yr today · 4 by 30 yrs out
Nearby sold comps map
Loading sold comps map…
Walkable amenities ~0.75 mi
Loading nearby amenities…
Taxation est. · year 1
- Rental income
- $191,284
- − Mortgage interest
- −$178,690
- − Property taxes
- −$23,986
- − Insurance
- −$17,418
- − Repairs & maintenance
- −$15,303
- − Management
- −$15,303
- − HOA
- −$528
- − Depreciation
- −$92,800
- Taxable loss
- −$152,743
- Est. tax savings @ 24.0%
- +$36,658
- After-tax cash flow
- $-54,903/yr
For passive investors: Depreciation is non-cash, so a rental often shows a tax loss while cash-flowing — sheltering income. Rental losses are passive: they offset passive income freely, and up to $25,000/yr can offset ordinary (W-2) income if you actively participate and your MAGI is under $100k (phasing out to $0 by $150k); unused losses carry forward. On sale, claimed depreciation is recaptured at up to 25%, and gains may owe capital-gains tax (a 1031 exchange can defer both). Figures are a year-1 estimate at your 24.0% rate — not tax advice; consult a CPA.
Schools (NCES district)
- District
- Brick Township Public School District
- NCES district ID
- 3402220
- Math proficiency
- 18% ▼ -24.00%
- Reading proficiency
- 43% ▼ -15.00%
- Median HH income
- $68,717
- Composite
- 28.31/100
- National rank
- #6785
- State rank
- #330 of 472 in NJ
Livability — Dover Beaches North
- Score
- 51/100
- State rank
- #534
- US rank
- #25468
Category grades
Schools grade is shown separately in the Schools card above.
Census & demographics
No demographic data for this ZIP.
Market trends
- HPI YoY
- ▲ 4.94%
- Current HPI
- 219.6027
- Rent YoY
- —
- Metro
- —
- State GDP YoY
- ▲ 2.05%
- F500 in state
- 34
Industry mix (Fortune 500 HQ in NJ)
| Industry | F500 HQs | Revenue |
|---|---|---|
| Consumer Goods | 3 | $31B |
|
||
| Pharmaceuticals | 2 | $153B |
|
||
| Technology | 2 | $21B |
|
||
| Insurance | 2 | $20B |
|
||
| Healthcare | 2 | $19B |
|
||
| Financial Services | 1 | $70B |
|
||
Price history
-8.9% since first listed2 events — show timeline
- 2026-05-21 Price Changed $3,190,000 MOMLS
- 2026-05-08 Listed $3,499,999 MOMLS
Property tax history
+70.6%/yrLatest (2025): $23,986 · +176.7% YoY. Source: county tax records.
Cash-flow waterfall
monthlySold comps — $/sqft
last 12 mo · ≤1 miLoading sold comps…