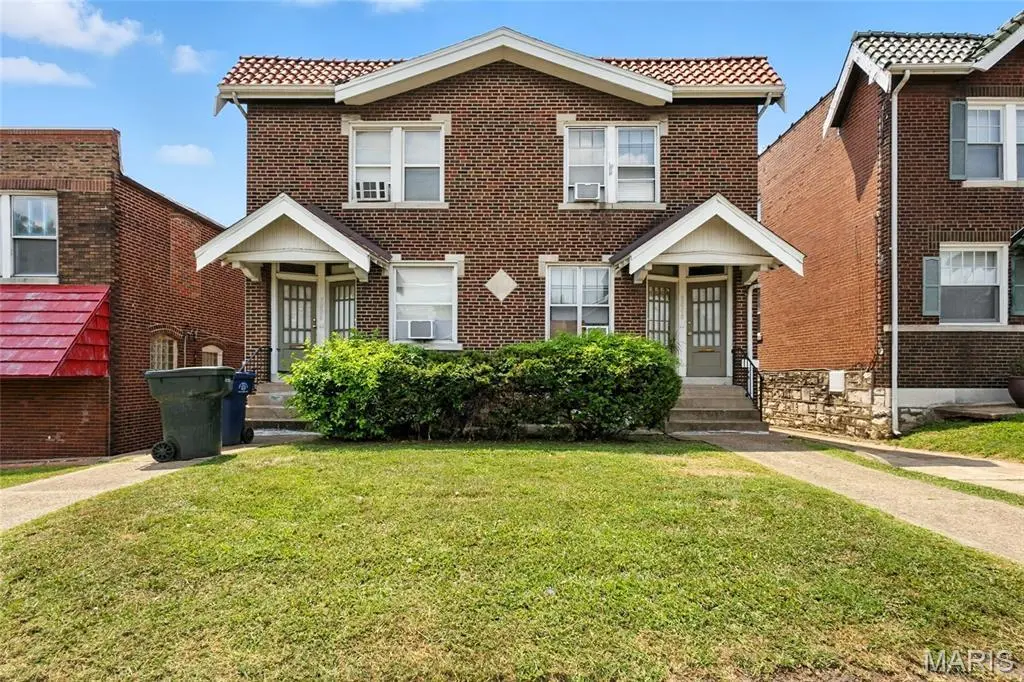
5006 - 5008 Chippewa
St. Louis, MO 63109
$335,000D+
16 bd · 16.0 ba ·
2,856 sqft ·
Built 1926
· MultiFamily
· Pending
· 260 DOM
Cashflow @ list (25.0% down · 7.5%)
Estimated rent
$3,462/mo
Mortgage (P&I)
−$1,757
Tax + insurance
−$558
HOA
−$0
Vac / Maint / Mgmt
−$727
Net cashflow
$420/mo
Annual
$5,038/yr
Cap rate
7.80%
Cash-on-cash
5.37%
DSCR
1.24
1% rule
1.03%
Cash to close
$93,800
Investor read
- This is a 4 × 1-bed/1.0-bath units multifamily listed at $335k.
- At list price, monthly cash flow is $420 ($5k/yr) — positive. Per door: $105/mo.
- The deal already cash-flows at list — no discount required.
- Meets the 1% rule at list price ($3k rent vs $335k).
- It's been on market 260 days — a 12% lower offer ($295k) is reasonable based on typical stale-listing flexibility.
- Recommended offer: $295k (12.0% below list) — sets the bar for market timing.
- Local home prices are declining (-3.0%/yr); year-one equity from $2k of loan paydown is wiped out by about $10k of value loss. Plan a longer hold.
- Location reads: area grade D — affects rentability + tenant quality, not the cash-flow math above.
- St. Louis City (urban): math 10% / reading 18% proficiency, ranked #312 of 324 in MO (top 96%) — low school quality limits family demand, transient renter base, plan for 1-2y turnover; 80% free/reduced lunch — lower-income household profile, screen leases tightly.
- Zoned schools: Buder Elem. (math 12% / reading 22%, grade F, #967 of 1,115 statewide, top 88%, 403 students, 99% FRL); Roosevelt High (math 2% / reading 8%, grade F, #517 of 521 statewide, top 100%, 460 students, 99% FRL) — zoned schools average 99% FRL vs 80% district-wide (19 pts higher); higher-poverty schools than district average — tighter screening recommended.
- Watch-outs: built in 1926 — expect roof / HVAC / electrical / plumbing capex.
- Market conditions: Rents rising (+4.0%/yr); 150 active listings in the ZIP; 294 units permitted in St. Louis city in 2024 (227 in 5+ unit buildings).
- St. Louis County population projected to shrink 6% by 2050 — rents likely to lag national; underwrite the cash flow, not the appreciation.
- Climate carrying-cost: extreme-heat days projected 7→21/yr by 2055 (HVAC capex compounding) — expect insurance premiums to compound above CPI over the hold.
- Cap rate 7.8% vs local median 5.0% in St. Louis — top-decile yield for the area; either an underpriced asset or a hidden risk that comps aren't pricing in. Stress-test before assuming the spread holds.
- At $3,462/mo this rent would consume 59% of the median local household income ($70k/yr) (locally 922% of renters already pay >50% of income on rent) — very limited rent-growth headroom before tenants either downsize or default.
Questions for listing agent
- It's been on market 260 days. Have you received any prior offers? Is the seller open to a 12% concession, seller financing, or rate buy-down credit?
- Can we see the unit-by-unit rent roll, current vacancy, and any below-market leases? What's the average tenancy length?
- What capital expenditures (roof, boiler, parking lot, exteriors) have been made in the last 5 years, and what's planned in the next 2?
- Built in 1926 — when were the roof, HVAC, electrical panel, plumbing, and water heater last replaced?
- Why hasn't it sold? Are there any deal-killer items the seller is aware of (foundation, flood, title, zoning, code violations)?
- Is there a deadline driving the sale (1031 exchange, divorce, estate, relocation)? That informs how much negotiation room exists.
- The area grade is low — what's the realistic commute time and amenity access for the typical tenant pool here? Any planned neighborhood developments (good or bad) we should know about?
- What's the average days-on-market for RENTAL listings here right now (not sales)? A rising rental-DOM trend means longer vacancies and softer asking-rent achievability than the comps imply.
CashFlowRE · CFR-RC4M9AB0HJ9NDN
· Data 3 weeks ago
cashflowre.app · 2026-05-29