 Fourplex
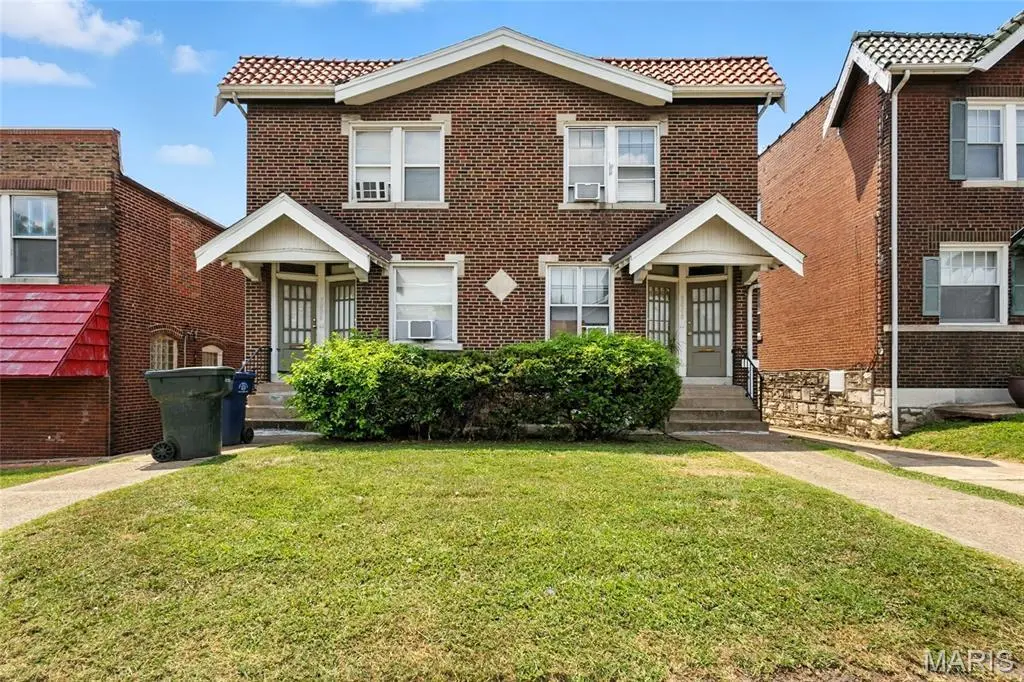
5006 - 5008 Chippewa · St. Louis, MO
Flood risk 1/10 · Minimal
- FEMA flood zone
- X (unshaded)
- Chance of flooding over 30 yrs
- 0.0%
- Est. flood insurance / yr
- $473 – $860
Fire risk 1/10 · Minimal
- Est. fire insurance / yr
- $1,054 – $1,958
Heat risk 5/10 · Moderate
- Hot days now (above 108°F)
- 7 days/yr
- Hot days in 30 yrs
- 21 days/yr
Wind risk 2/10 · Minimal
- Chance of severe wind over 30 yrs
- 1.0%
Air-quality risk 3/10 · Minor
- Unhealthy air days now
- 3 days/yr
- Unhealthy air days in 30 yrs
- 4 days/yr
Risk factors via First Street. Map © Google.
Why this score? — see what drove the D+ grade
The composite is a weighted blend of 9 inputs, each scored 0–100. Each bar is that input's sub-score; the figure is the points it added to the 100-point composite (weight × sub-score).
- Cash flow +20.1/30.0
- ARV discount +7.5/15.0
- DSCR +6.4/10.0
- 1% rule +5.3/10.0
- Rent growth +3.5/5.0
- Livability +2.5/5.0
- Condition / age +2.5/5.0
- Schools +1.2/10.0
- Appreciation +0.0/10.0
$335,000
🖨 Deal sheet 📄 Offer letter ✓ Due diligence
Multi-family units
County records classify this as Multi-Family (2-4 Unit). Listing-text estimate: 4 units. confirmed
Listing remarks
This well-maintained 4-unit quadplex is the perfect addition to your portfolio, offering steady rental income from fully occupied, 1-bedroom/1-bath units. Each unit features a comfortable living room, spacious eat-in kitchen with appliances, and private bedroom & bath. Tenants enjoy the balconies, a concrete parking pad, and designated washer/dryer hookups with storage in the shared basement. Ideally located in the highly sought-after North Hampton neighborhood, this property offers both charm and convenience—close to parks, shopping, dining, and major highways. Don’t miss out on this rare, low-maintenance, income-generating property! Second Building also for sale - 5026
Key facts
- Private bedroom
- Private bath
- Fully occupied units
Tags
Property features AI
Finance
- Other: Gross above-grade finished area recorded as 2,856 (source: public records)
- Financial info: No lease considered (seller not accepting lease offers); No second mortgage indicated; Seller may consider concessions
- HOA & community: Community contains 4 units
Exterior
- Parking: Parking for 6 vehicles total; Off-street parking in a parking lot
- Security: No security features listed
- Utilities: No specific utility provider details listed
- Home design: Residential income property; 2–4 unit building; Single building containing 4 units; Located on a 0.14-acre lot; Southampton neighborhood
- Construction: Brick and stone construction
- Exterior features: Concrete parking areas and off-street parking lot
Interior
- Kitchen: No specific kitchen appliance details provided
- Bedrooms: Four 1-bedroom units (unit-level details)
- Flooring: No flooring details provided
- Bathrooms: Four 1-bath units (unit-level details)
- Heating & cooling: Forced air heating; Wall/window air conditioning units
- Interior features: Basement with unfinished storage space; Two levels
- Laundry & utility: No specific laundry or utility appliances listed
Neighborhood map
What this means for you Summary
Snapshot
- This is a 4 × 1-bed/1.0-bath units multifamily listed at $335k.
Deal economics
- At list price, monthly cash flow is $420 ($5k/yr) — positive. Per door: $105/mo.
- The deal already cash-flows at list — no discount required.
- Meets the 1% rule at list price ($3k rent vs $335k).
- Recommended offer: $295k (12.0% below list) — sets the bar for market timing.
- Cap rate 7.8% vs local median 5.0% in St. Louis — top-decile yield for the area; either an underpriced asset or a hidden risk that comps aren't pricing in. Stress-test before assuming the spread holds.
Location & tenants
- Location reads: area grade D — affects rentability + tenant quality, not the cash-flow math above.
- St. Louis City (urban): math 10% / reading 18% proficiency, ranked #312 of 324 in MO (top 96%) — low school quality limits family demand, transient renter base, plan for 1-2y turnover; 80% free/reduced lunch — lower-income household profile, screen leases tightly.
- Zoned schools: Buder Elem. (math 12% / reading 22%, grade F, #967 of 1,115 statewide, top 88%, 403 students, 99% FRL); Roosevelt High (math 2% / reading 8%, grade F, #517 of 521 statewide, top 100%, 460 students, 99% FRL) — zoned schools average 99% FRL vs 80% district-wide (19 pts higher); higher-poverty schools than district average — tighter screening recommended.
- Market conditions: Rents rising (+4.0%/yr); 150 active listings in the ZIP; 294 units permitted in St. Louis city in 2024 (227 in 5+ unit buildings).
- At $3,462/mo this rent would consume 59% of the median local household income ($70k/yr) (locally 922% of renters already pay >50% of income on rent) — very limited rent-growth headroom before tenants either downsize or default.
Forward outlook
- Local home prices are declining (-3.0%/yr); year-one equity from $2k of loan paydown is wiped out by about $10k of value loss. Plan a longer hold.
- St. Louis County population projected to shrink 6% by 2050 — rents likely to lag national; underwrite the cash flow, not the appreciation.
Negotiation context
- It's been on market 260 days — a 12% lower offer ($295k) is reasonable based on typical stale-listing flexibility.
Risks & watch-outs
- Watch-outs: built in 1926 — expect roof / HVAC / electrical / plumbing capex.
- Climate carrying-cost: extreme-heat days projected 7→21/yr by 2055 (HVAC capex compounding) — expect insurance premiums to compound above CPI over the hold.
Questions for the listing agent
- It's been on market 260 days. Have you received any prior offers? Is the seller open to a 12% concession, seller financing, or rate buy-down credit?
- Can we see the unit-by-unit rent roll, current vacancy, and any below-market leases? What's the average tenancy length?
- What capital expenditures (roof, boiler, parking lot, exteriors) have been made in the last 5 years, and what's planned in the next 2?
- Built in 1926 — when were the roof, HVAC, electrical panel, plumbing, and water heater last replaced?
- Why hasn't it sold? Are there any deal-killer items the seller is aware of (foundation, flood, title, zoning, code violations)?
- Is there a deadline driving the sale (1031 exchange, divorce, estate, relocation)? That informs how much negotiation room exists.
- The area grade is low — what's the realistic commute time and amenity access for the typical tenant pool here? Any planned neighborhood developments (good or bad) we should know about?
- What's the average days-on-market for RENTAL listings here right now (not sales)? A rising rental-DOM trend means longer vacancies and softer asking-rent achievability than the comps imply.
- What's the recent tenant-quality profile in this submarket — average credit score on applications, eviction rate, late-payment / NSF rate, and stable-employment percentage? A property-management company in the area should have these aggregated.
- How much new apartment / multifamily construction is in the pipeline within 1–3 miles? Heavy new supply (>2% of stock underway) typically softens rents 12–24 months out; light construction supports rent growth.
Investment metrics
- 1% rule
- 1.03% ✓
- Cap rate
- 7.80%
- Cash-on-cash
- 5.37%
- DSCR
- 1.24
- GRM
- 8.1
CMA / ARV
No comps found within radius.
Projected returns pro-forma
-3.0% appreciation · 3.98% rent growth · sell at horizon
- IRR
- -6.9%
- Equity multiple
- 0.74×
- Total profit
- $-24,044
- Equity at exit
- $49,950
- IRR
- 3.9%
- Equity multiple
- 1.30×
- Total profit
- $28,139
- Equity at exit
- $28,965
Cash invested: $93,800 (down + closing). Projections, not guarantees.
Landlord ↔ Tenant lean methodology
- Overall (STATE)
- 81 Strongly Landlord-Friendly
- State Missouri
- 81 Strongly Landlord-Friendly · R+10
- County
- — inherits STATE
- City
- — inherits STATE
ZIP-level market 63109
- Rents YoY
- 4.0%
- Active inventory
- 150
- Price-to-rent
- 32.3×
Monthly cashflow live
- Estimated rent
- $3,462 high interval (Pro) →
- Mortgage (P&I)
- −$1,757
- Tax est. 1.5%
- −$419 /mo · $5,025/yr
- Insurance
- −$140
- HOA
- −$0
- Vacancy / Maint / Mgmt
- −$727
- Net cashflow
- $420
Break-even live
4-unit breakdown (identical units grouped — click to expand)
| Units | Beds | Baths | Est. rent |
|---|---|---|---|
| 4× units | 1 | 1 | $3,464 |
| #1 | 1 | 1 | $866 |
| #2 | 1 | 1 | $866 |
| #3 | 1 | 1 | $866 |
| #4 | 1 | 1 | $866 |
| Total (4 units) | $3,462 | ||
UW: 25.0% down · 7.5% · 30yr · 1.5% tax · 5.0% vac · 8.0% maint · 8.0% mgmt
Financing live
Cash to close
- Down payment
- $83,750
- Closing costs
- $10,050
- Reserves months
- —
- Total cash needed
- —
Loan-product check · same deal, 3 products live
Conventional
25% down · 7.5% · 30yr
- Down + closing
- —
- Monthly P&I
- —
- Monthly cashflow
- —
- DSCR
- —
- Eligible?
- —
Personal DTI + credit; lowest rate.
DSCR
20% down · 8.5% · 30yr
- Down + closing
- —
- Monthly P&I
- —
- Monthly cashflow
- —
- DSCR
- —
- Eligible?
- —
No personal income docs; deal must DSCR.
Hard money
10% down · 12.0% · 12mo
- Down + closing
- —
- Monthly P&I
- —
- Monthly cashflow
- —
- DSCR
- —
- Eligible?
- —
Short-term bridge; refi at stabilization.
Listing history 5 events
-
2026-04-30status Pending
-
2026-03-13price $335,000
-
2026-01-30price $350,000
-
2025-09-29price $375,000
-
2025-08-13$400,000 Active
ⓘ Source: listings_history table (triggers on properties + properties_extension) + one-shot
backfill from property_details.listing_events for pre-trigger history.
Climate risk First Street
- Flood 1/10 Low FEMA zone X (unshaded) · 0% chance over 30 yrs
- Wildfire 1/10 Low
- Heat 5/10 Major 7 d/yr ≥108°F today · 21 d/yr by 30 yrs out
- Wind 2/10 Low 100% chance of damaging wind over 30 yrs
- Air quality 3/10 Moderate 3 unhealthy d/yr today · 4 by 30 yrs out
Nearby sold comps map
Loading sold comps map…
Walkable amenities ~0.75 mi
Loading nearby amenities…
Taxation est. · year 1
- Rental income
- $41,544
- − Mortgage interest
- −$18,765
- − Property taxes
- −$5,025
- − Insurance
- −$1,675
- − Repairs & maintenance
- −$3,324
- − Management
- −$3,324
- − Depreciation
- −$9,745
- Taxable loss
- −$314
- Est. tax savings @ 24.0%
- +$75
- After-tax cash flow
- $5,114/yr
For passive investors: Depreciation is non-cash, so a rental often shows a tax loss while cash-flowing — sheltering income. Rental losses are passive: they offset passive income freely, and up to $25,000/yr can offset ordinary (W-2) income if you actively participate and your MAGI is under $100k (phasing out to $0 by $150k); unused losses carry forward. On sale, claimed depreciation is recaptured at up to 25%, and gains may owe capital-gains tax (a 1031 exchange can defer both). Figures are a year-1 estimate at your 24.0% rate — not tax advice; consult a CPA.
Schools (NCES district)
- District
- St. Louis City
- NCES district ID
- 2929280
- Math proficiency
- 10% ▼ -6.00%
- Reading proficiency
- 18% ▼ -3.00%
- Median HH income
- $35,685
- Composite
- 11.54/100
- National rank
- #9699
- State rank
- #312 of 324 in MO
Livability — St. Louis
No livability data for this city. (Only ~50 U.S. cities are tracked.)
Census & demographics
- Census place
- St. Louis, MO
- County
- Saint Louis City · 254,015 people
- City population
- 283,259
- Metro
- St. Louis, MO-IL
- Population (ZIP)
- 25,236
- Household income
- $69,938
- Rent vs Own
- Severe rent burden
- 922.0
Population outlook (St. Louis County) Hauer SSP2
- Today (2025)
- 315,737 people
- By 2030
- 313,865 · -0.6%
- By 2040
- 305,439 · -3.3%
- By 2050
- 296,529 · -6.1%
- By 2075
- 271,028 · -14.2%
- By 2100
- 255,359 · -19.1%
Race, ethnicity, and origin ACS 2023
- Neighborhood character
- Predominantly White (87%)
- Race & ethnicity
- White 87% Black 6% Two or more races 3% Hispanic / Latino 3% Asian 1%
- Common ancestry
- Romanian 3% Lithuanian 3% Slovak 2%
- Foreign-born
- 4% · Canada
- Languages at home
- 94% English-only · Other Indo-European 2% Spanish 1% Russian/Polish/Slavic 1%
Political lean MEDSL · St. Louis
- 2024 margin
- Solid D (+64.7) · D 81.4% · R 16.7% · Other 2.0%
- 2008→2024 swing
- -3.5pp toward R · 2008: 68.2pp · 2024: 64.7pp
- All cycles
- 2024: D+64.7 2020: D+66.2 2016: D+63.7 2012: D+66.6 2008: D+68.2
Not yet ingested
- Civics
- —
Market trends
- HPI YoY
- ▼ -215.58%
- Current HPI
- 250.5412
- Rent YoY
- ▲ 3.98%
- Metro
- St. Louis, MO-IL
- State GDP YoY
- ▲ 1.84%
- F500 in state
- 20
Industry mix (Fortune 500 HQ in MO)
| Industry | F500 HQs | Revenue |
|---|---|---|
| Healthcare | 1 | $163B |
|
||
| Insurance | 1 | $21B |
|
||
| Industrial Technology | 1 | $17B |
|
||
| Retail | 1 | $16B |
|
||
| Industrial Distribution | 1 | $10B |
|
||
| Utilities | 1 | $9B |
|
||
Price history
-16.2% since first listed5 events — show timeline
- 2026-04-30 Pending — MARIS as Distributed by MLS Grid
- 2026-03-13 Price Changed $335,000 MARIS as Distributed by MLS Grid
- 2026-01-30 Price Changed $350,000 MARIS as Distributed by MLS Grid
- 2025-09-29 Price Changed $375,000 MARIS as Distributed by MLS Grid
- 2025-08-13 Listed $400,000 MARIS as Distributed by MLS Grid
Cash-flow waterfall
monthlySold comps — $/sqft
last 12 mo · ≤1 miLoading sold comps…