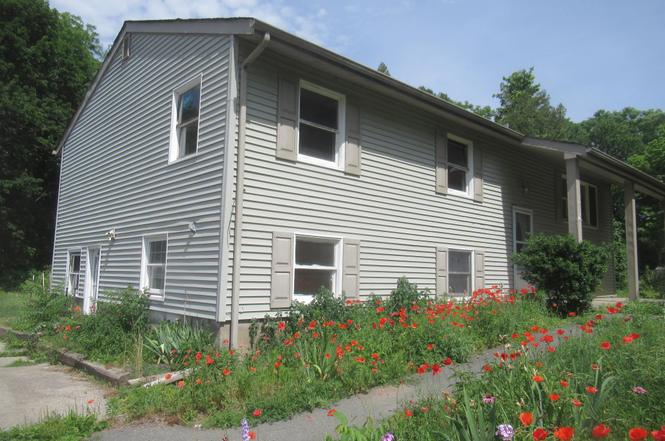
11 Myrtle Ave
Walden, NY 12586
$285,000D
4 bd · 2.5 ba ·
2,296 sqft ·
Built 1971
· SingleFamily
· Active
· 7 DOM
Cashflow @ list (25.0% down · 7.5%)
Estimated rent
$2,900/mo
Mortgage (P&I)
−$1,495
Tax + insurance
−$832
HOA
−$0
Vac / Maint / Mgmt
−$609
Net cashflow
$-35/mo
Annual
$-425/yr
Cap rate
6.14%
Cash-on-cash
-0.53%
DSCR
0.98
1% rule
1.02%
Cash to close
$79,800
Investor read
- This is a 4-bed/2.5-bath single-family listed at $285k.
- At list price, monthly cash flow is $-35 ($-425/yr) — negative.
- To cash-flow at today's rent, offer at most $279k (2.2% below list).
- Meets the 1% rule at list price ($3k rent vs $285k).
- Only 7 days on market — expect competitive offers; lowballing is unlikely to land.
- Recommended offer: $279k (2.2% below list) — sets the bar for cash-flow.
- Local home prices are declining (-3.0%/yr); year-one equity from $2k of loan paydown is wiped out by about $9k of value loss. Plan a longer hold.
- Location reads 67/100 on livability (#587 in NY) — a middle-class / working-renter tenant base. Strengths: housing A+, employment A; Watch: cost of living D, amenities F, commute F.
- Valley Central School District (Montgomery) (rural): math 54% / reading 53% proficiency, ranked #299 of 590 in NY (top 51%) — acceptable for families but not a draw, mixed tenant base, ~2y average lease.
- Zoned schools: Walden Elementary School (math 22% / reading 42%, grade F, #1,646 of 2,108 statewide, top 80%, 411 students, 48% FRL); Valley Central Middle School (math 28% / reading 42%, grade F, #480 of 729 statewide, top 66%, 982 students, 41% FRL); Valley Central High School (math 95% / reading 87%, grade A+, #203 of 1,100 statewide, top 20%, 1,346 students, 39% FRL) — zoned schools average 43% FRL vs 25% district-wide (17 pts higher); higher-poverty schools than district average — tighter screening recommended.
- Watch-outs: property tax is 3.0% of price.
- Market conditions: 72 active listings in the ZIP; 2 comparable units currently listed for rent nearby; 1,746 units permitted in Orange County in 2024 (1,265 in 5+ unit buildings).
- 2 sale attempts with the ask held roughly flat each time — persistent listings suggest the price (not the market) is what's stuck; bring a comps-based counter.
- Cap rate 6.1% vs local median 2.5% in Walden — top-decile yield for the area; either an underpriced asset or a hidden risk that comps aren't pricing in. Stress-test before assuming the spread holds.
Questions for listing agent
- What do current leases actually rent for vs. the listed asking? Can we see a recent rent roll and the last 12 months of T-12 income?
- Built in 1971 — when were the roof, HVAC, electrical panel, plumbing, and water heater last replaced?
- Property tax is high relative to price — has the assessment been appealed recently, and will the sale trigger a re-assessment?
- Is there a deadline driving the sale (1031 exchange, divorce, estate, relocation)? That informs how much negotiation room exists.
- Schools are D-rated, which usually means shorter tenancies and higher turnover. Who's the typical renter profile here, and what's been the actual vacancy rate?
- The area grade is low — what's the realistic commute time and amenity access for the typical tenant pool here? Any planned neighborhood developments (good or bad) we should know about?
- What's the average days-on-market for RENTAL listings here right now (not sales)? A rising rental-DOM trend means longer vacancies and softer asking-rent achievability than the comps imply.
- What's the recent tenant-quality profile in this submarket — average credit score on applications, eviction rate, late-payment / NSF rate, and stable-employment percentage? A property-management company in the area should have these aggregated.
CashFlowRE · CFR-RC6X4P8C7H15KP
· Data 14 h ago
cashflowre.app · 2026-05-29