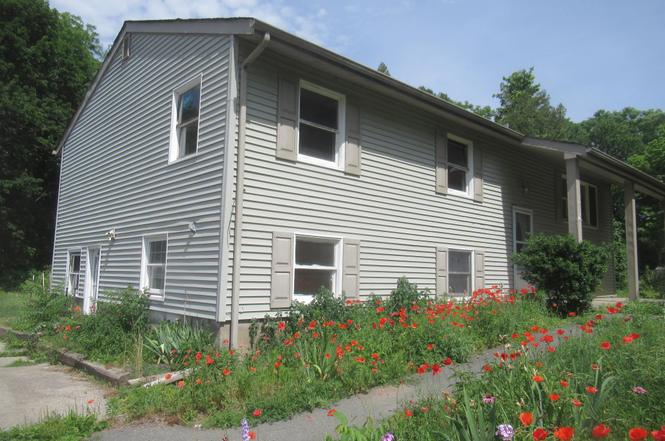
11 Myrtle Ave · Walden, NY
Flood risk 1/10 · Minimal
- FEMA flood zone
- X (unshaded)
- Chance of flooding over 30 yrs
- 0.0%
- Est. flood insurance / yr
- $473 – $860
Fire risk 4/10 · Minor
- Est. fire insurance / yr
- $691 – $1,283
Heat risk 4/10 · Minor
- Hot days now (above 96°F)
- 7 days/yr
- Hot days in 30 yrs
- 15 days/yr
Wind risk 4/10 · Minor
- Chance of severe wind over 30 yrs
- 12.0%
Air-quality risk 2/10 · Minimal
- Unhealthy air days now
- 1 days/yr
- Unhealthy air days in 30 yrs
- 2 days/yr
Risk factors via First Street. Map © Google.
Why this score? — see what drove the D grade
The composite is a weighted blend of 9 inputs, each scored 0–100. Each bar is that input's sub-score; the figure is the points it added to the 100-point composite (weight × sub-score).
- Cash flow +12.6/30.0
- ARV discount +7.5/15.0
- 1% rule +5.2/10.0
- Schools +4.8/10.0
- DSCR +3.8/10.0
- Livability +3.4/5.0
- Rent growth +2.5/5.0
- Condition / age +2.5/5.0
- Appreciation +0.0/10.0
$285,000
🖨 Deal sheet (PDF) 📄 Offer letter ✓ Due diligence
Listing remarks
Great starter home! 4 bedroom 2.5 bath Raised Ranch in the Town of Montgomery! Located on a quite private road, this 2,296 sqft. home offers amazing potential. Hardwood flooring through out 1st floor, Bright living room with bay window, dining area, & 1st floor laundry. If you enjoy cooking you will love this massive kitchen with plenty of pantry, cabinet & counter space. Plenty of room on the lower level for office space, play room, or family room. Entertain on your rear deck or relax on your covered rocking chair front porch. Close to I-84, I-87, Beacon Newburgh Bridge, & Stewart Airport.
Key facts
- Hardwood flooring
- Private road
- Close to i-84
Tags
Property features AI
Exterior
- Parking: Driveway; No carport
- Utilities: Septic tank sewer; Electricity connected
- Home design: Single family residence; Living area per public records
- Construction: Frame construction materials
- Exterior features: Frame construction; Not waterfront; No additional parcels
Interior
- Kitchen: Oven
- Bedrooms: 6 total rooms (bedroom count not specified)
- Bathrooms: 2 full bathrooms; 1 half bathroom
- Heating & cooling: Baseboard heating; Other heating; No central cooling
- Interior features: Finished walk-out basement; Full finished basement; Attic with pull-down stairs; Other interior features
- Laundry & utility: Basement utility space
Neighborhood map
What this means for you Summary
Snapshot
- This is a 4-bed/2.5-bath single-family listed at $285k.
Deal economics
- At list price, monthly cash flow is $-35 ($-425/yr) — negative.
- To cash-flow at today's rent, offer at most $279k (2.2% below list).
- Meets the 1% rule at list price ($3k rent vs $285k).
- Recommended offer: $279k (2.2% below list) — sets the bar for cash-flow.
- Cap rate 6.1% vs local median 2.5% in Walden — top-decile yield for the area; either an underpriced asset or a hidden risk that comps aren't pricing in. Stress-test before assuming the spread holds.
Location & tenants
- Location reads 67/100 on livability (#587 in NY) — a middle-class / working-renter tenant base. Strengths: housing A+, employment A; Watch: cost of living D, amenities F, commute F.
- Valley Central School District (Montgomery) (rural): math 54% / reading 53% proficiency, ranked #299 of 590 in NY (top 51%) — acceptable for families but not a draw, mixed tenant base, ~2y average lease.
- Zoned schools: Walden Elementary School (math 22% / reading 42%, grade F, #1,646 of 2,108 statewide, top 80%, 411 students, 48% FRL); Valley Central Middle School (math 28% / reading 42%, grade F, #480 of 729 statewide, top 66%, 982 students, 41% FRL); Valley Central High School (math 95% / reading 87%, grade A+, #203 of 1,100 statewide, top 20%, 1,346 students, 39% FRL) — zoned schools average 43% FRL vs 25% district-wide (17 pts higher); higher-poverty schools than district average — tighter screening recommended.
- Market conditions: 72 active listings in the ZIP; 2 comparable units currently listed for rent nearby; 1,746 units permitted in Orange County in 2024 (1,265 in 5+ unit buildings).
Forward outlook
- Local home prices are declining (-3.0%/yr); year-one equity from $2k of loan paydown is wiped out by about $9k of value loss. Plan a longer hold.
Negotiation context
- Only 7 days on market — expect competitive offers; lowballing is unlikely to land.
- 2 sale attempts with the ask held roughly flat each time — persistent listings suggest the price (not the market) is what's stuck; bring a comps-based counter.
Risks & watch-outs
- Watch-outs: property tax is 3.0% of price.
Questions for the listing agent
- What do current leases actually rent for vs. the listed asking? Can we see a recent rent roll and the last 12 months of T-12 income?
- Built in 1971 — when were the roof, HVAC, electrical panel, plumbing, and water heater last replaced?
- Property tax is high relative to price — has the assessment been appealed recently, and will the sale trigger a re-assessment?
- Is there a deadline driving the sale (1031 exchange, divorce, estate, relocation)? That informs how much negotiation room exists.
- Schools are D-rated, which usually means shorter tenancies and higher turnover. Who's the typical renter profile here, and what's been the actual vacancy rate?
- The area grade is low — what's the realistic commute time and amenity access for the typical tenant pool here? Any planned neighborhood developments (good or bad) we should know about?
- What's the average days-on-market for RENTAL listings here right now (not sales)? A rising rental-DOM trend means longer vacancies and softer asking-rent achievability than the comps imply.
- What's the recent tenant-quality profile in this submarket — average credit score on applications, eviction rate, late-payment / NSF rate, and stable-employment percentage? A property-management company in the area should have these aggregated.
- How much new for-sale + rental construction is in the pipeline within 1–3 miles? Heavy new supply typically softens prices + rents 12–24 months out; constrained supply supports both.
Investment metrics
- 1% rule
- 1.02% ✓
- Cap rate
- 6.14%
- Cash-on-cash
- -0.53%
- DSCR
- 0.98
- GRM
- 8.2
CMA / ARV
- ARV (on-the-fly)
- $617,624
- Comps found
- 2
Show comp detail 2 sales within ~0.75 mi
| Address | Dist | Beds/Ba | Sqft | Sold | Price | $/sf | Match |
|---|---|---|---|---|---|---|---|
| 38 Tassielli Dr | 0.35mi | 4/3.5 | 2,600 (+13%) | 16mo | $562,000 | $216 | 44 |
| 138 Round Hill Rd | 0.63mi | 3/2.5 (-1) | 1,986 (-14%) | 1mo | $534,000 | $269 | 42 |
Match score weights: distance 35% · size 25% · config 20% · recency 20%. Top-matched comps best support the ARV.
Projected returns pro-forma
-3.0% appreciation · 3.0% rent growth · sell at horizon
- IRR
- -17.1%
- Equity multiple
- 0.40×
- Total profit
- $-48,174
- Equity at exit
- $42,494
- IRR
- -8.8%
- Equity multiple
- 0.45×
- Total profit
- $-43,783
- Equity at exit
- $24,642
Cash invested: $79,800 (down + closing). Projections, not guarantees.
Landlord ↔ Tenant lean methodology
- Overall (STATE)
- 15 Strongly Tenant-Friendly
- State New York
- 15 Strongly Tenant-Friendly · D+10
- County
- — inherits STATE
- City
- — inherits STATE
ZIP-level market 12586
- Home prices YoY
- -15.6%
- Active inventory
- 72
- Price-to-rent
- 8.2×
Monthly cashflow live
- Estimated rent
- $2,900 medium interval (Pro) →
- Mortgage (P&I)
- −$1,495
- Tax from tax record
- −$713 /mo · $8,557/yr
- Insurance
- −$119
- HOA
- −$0
- Vacancy / Maint / Mgmt
- −$609
- Net cashflow
- $-35
Break-even live
Sensitivity live
| Price | -10% $126 | -5% $45 | +0% $-35 | +5% $-116 | +10% $-197 |
|---|---|---|---|---|---|
| Rent | -10% $-264 | -5% $-150 | +0% $-35 | +5% $79 | +10% $194 |
| Rate | -1.0pp $108 | -0.5pp $37 | base $-35 | +0.5pp $-109 | +1.0pp $-184 |
UW: 25.0% down · 7.5% · 30yr · 1.5% tax · 5.0% vac · 8.0% maint · 8.0% mgmt
Financing live
Cash to close
- Down payment
- $71,250
- Closing costs
- $8,550
- Reserves months
- —
- Total cash needed
- —
Loan-product check · same deal, 3 products live
Conventional
25% down · 7.5% · 30yr
- Down + closing
- —
- Monthly P&I
- —
- Monthly cashflow
- —
- DSCR
- —
- Eligible?
- —
Personal DTI + credit; lowest rate.
DSCR
20% down · 8.5% · 30yr
- Down + closing
- —
- Monthly P&I
- —
- Monthly cashflow
- —
- DSCR
- —
- Eligible?
- —
No personal income docs; deal must DSCR.
Hard money
10% down · 12.0% · 12mo
- Down + closing
- —
- Monthly P&I
- —
- Monthly cashflow
- —
- DSCR
- —
- Eligible?
- —
Short-term bridge; refi at stabilization.
Rent comps 2 comps
| Address | Beds | Baths | Sqft | Rent | $/sqft | DOM | Units | Dist |
|---|---|---|---|---|---|---|---|---|
| 118 Plains Rd Unit 2 Walden, NY | 3.0 | 2.0 | 1800 | $2,900 | $1.61 | 25d | 1 | 0.85mi |
| 118 Plains Rd Unit 2 Walden, NY | 3.0 | 2.0 | 1800 | $2,900 | $1.61 | 45d | 1 | 0.85mi |
Listing history 6 events
-
2026-06-22days on market $285,000 Active 7 DOM
-
2026-06-18days on market $285,000 Active 4 DOM
-
2026-06-17days on market $285,000 Active 3 DOM
-
2026-06-16days on market $285,000 Active 2 DOM
-
2026-06-15remarks 601-char remark
-
2026-06-15$285,000 Active 1 DOM
ⓘ Source: listings_history table (triggers on properties + properties_extension) + one-shot
backfill from property_details.listing_events for pre-trigger history.
Tax reassessment forecast NY · Partial reset (capped growth)
- Current annual tax
- $8,557 · $713/mo
- Projected year-2 tax
- $8,557 · $713/mo
- Expected delta
- $0/yr ($0/mo · 0.0%)
ⓘ Screening estimate from a state-policy table — verify with the county assessor before closing.
Climate risk First Street
- Flood 1/10 Low FEMA zone X (unshaded) · 0% chance over 30 yrs
- Wildfire 4/10 Moderate
- Heat 4/10 Moderate 7 d/yr ≥96°F today · 15 d/yr by 30 yrs out
- Wind 4/10 Moderate 12% chance of damaging wind over 30 yrs
- Air quality 2/10 Low 1 unhealthy d/yr today · 2 by 30 yrs out
Nearby sold comps map
Loading sold comps map…
Walkable amenities ~0.75 mi
Loading nearby amenities…
Taxation est. · year 1
- Rental income
- $34,800
- − Mortgage interest
- −$15,964
- − Property taxes
- −$8,557
- − Insurance
- −$1,425
- − Repairs & maintenance
- −$2,784
- − Management
- −$2,784
- − Depreciation
- −$8,291
- Taxable loss
- −$5,005
- Est. tax savings @ 24.0%
- +$1,201
- After-tax cash flow
- $777/yr
For passive investors: Depreciation is non-cash, so a rental often shows a tax loss while cash-flowing — sheltering income. Rental losses are passive: they offset passive income freely, and up to $25,000/yr can offset ordinary (W-2) income if you actively participate and your MAGI is under $100k (phasing out to $0 by $150k); unused losses carry forward. On sale, claimed depreciation is recaptured at up to 25%, and gains may owe capital-gains tax (a 1031 exchange can defer both). Figures are a year-1 estimate at your 24.0% rate — not tax advice; consult a CPA.
Schools (NCES district)
- District
- Valley Central School District (Montgomery)
- NCES district ID
- 3619680
- Math proficiency
- 54% ▼ -7.00%
- Reading proficiency
- 53% ▲ 1.00%
- Median HH income
- $69,186
- Composite
- 47.53/100
- National rank
- #2271
- State rank
- #299 of 590 in NY
Livability — Walden
- Score
- 67/100
- State rank
- #587
- US rank
- #10610
Category grades
Schools grade is shown separately in the Schools card above.
Census & demographics
- City population
- 12,874
- Population (ZIP)
- 12,874
Population outlook (Orange County) Hauer SSP2
- Today (2025)
- 379,830 people
- By 2030
- 378,955 · -0.2%
- By 2040
- 375,444 · -1.2%
- By 2050
- 369,311 · -2.8%
- By 2075
- 354,233 · -6.7%
- By 2100
- 318,150 · -16.2%
Race, ethnicity, and origin ACS 2023
- Neighborhood character
- Diverse neighborhood (Simpson 0.57)
- Race & ethnicity
- White 61% Hispanic / Latino 23% Two or more races 15% Black 7% Asian 2% Native American 2%
- Hispanic origin (detail)
- Mexican 6% Puerto Rican 9% Dominican 3%
- Common ancestry
- Romanian 3% Italian 3% Iranian 3%
- Foreign-born
- 12% · Canada, Jamaica, China
- Languages at home
- 85% English-only · Spanish 10% Other Indo-European 3%
Political lean MEDSL · Orange
- 2024 margin
- Lean R (+8.4) · D 45.8% · R 54.2%
- 2008→2024 swing
- -12.5pp toward R · 2008: 4.1pp · 2024: -8.4pp
- All cycles
- 2024: R+8.4 2020: R+0.2 2016: R+6.5 2012: D+5.2 2008: D+4.1
Not yet ingested
- Civics
- —
Market trends
- HPI YoY
- ▼ -58.44%
- Current HPI
- 315.1034
- Rent YoY
- —
- Metro
- —
- State GDP YoY
- ▲ 2.60%
- F500 in state
- 92
Industry mix (Fortune 500 HQ in NY)
| Industry | F500 HQs | Revenue |
|---|---|---|
| Financial Services | 10 | $950B |
|
||
| Consumer Goods | 9 | $162B |
|
||
| Insurance | 4 | $225B |
|
||
| Telecommunications | 2 | $144B |
|
||
| Pharmaceuticals | 2 | $112B |
|
||
| Media / Entertainment | 2 | $69B |
|
||
Price history
-30.5% since first listed2 events — show timeline
- 2026-06-13 Listed $285,000 OneKey® MLS as Distributed by MLS Grid
- 2026-02-24 Listed $410,000 OneKey® MLS as Distributed by MLS Grid
Property tax history
+2.4%/yrLatest (2025): $8,557 · +4.2% YoY. Source: county tax records.
Cash-flow waterfall
monthlySold comps — $/sqft
last 12 mo · ≤1 miLoading sold comps…