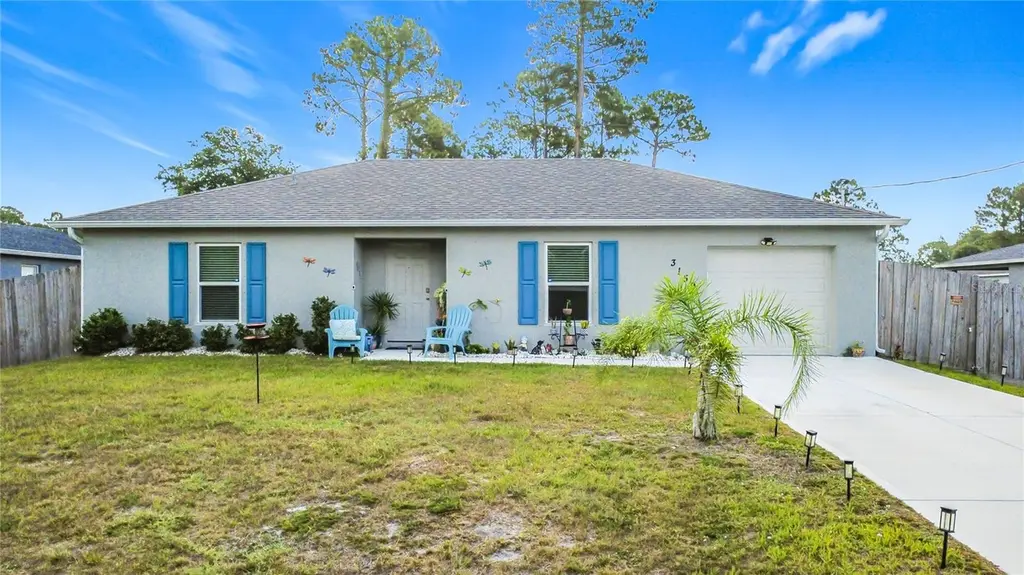
3159 Aspen Rd
Palm Bay, FL 32909
$294,500D+
3 bd · 2.0 ba ·
1,230 sqft ·
Built 2023
· SingleFamily
· Active
· 20 DOM
Cashflow @ list (25.0% down · 7.5%)
Estimated rent
$2,100/mo
Mortgage (P&I)
−$1,544
Tax + insurance
−$253
HOA
−$0
Vac / Maint / Mgmt
−$441
Net cashflow
$-138/mo
Annual
$-1,654/yr
Cap rate
5.73%
Cash-on-cash
-2.01%
DSCR
0.91
1% rule
0.71%
Cash to close
$82,460
Investor read
- This is a 3-bed/2.0-bath single-family listed at $294k.
- At list price, monthly cash flow is $-138 ($-2k/yr) — negative.
- To cash-flow at today's rent, offer at most $270k (8.3% below list).
- To meet the 1% rule (rent ≥ 1% of price), the offer needs to be $210k (28.7% below list).
- It's been on market 20 days — a 2% lower offer ($290k) is reasonable based on typical stale-listing flexibility.
- Recommended offer: $210k (28.7% below list) — sets the bar for 1% rule.
- In year one you build about $31k of equity ($2k loan paydown + $29k appreciation (10.0% local appreciation)).
- Location reads 72/100 on livability (#366 in FL) — a middle-class / working-renter tenant base. Strengths: cost of living A+, housing A+; Watch: schools C-, employment D+, amenities F.
- Brevard (suburban): math 53% / reading 57% proficiency, ranked #19 of 73 in FL (top 26%) — acceptable for families but not a draw, mixed tenant base, ~2y average lease.
- Market conditions: Rents rising (+3.7%/yr); 1111 active listings in the ZIP; 4 comparable units currently listed for rent nearby; rentals at typical pace (median 24d on market — plan ~3-4 weeks tenant-placement turnaround); solid renter incomes; 4,602 units permitted in Brevard County in 2024 (702 in 5+ unit buildings).
- Brevard County population projected at +15% by 2050 — modest demand growth; plan on rents tracking national, not racing it.
- 10 sale attempts since 20y ago with the ask held roughly flat each time — persistent listings suggest the price (not the market) is what's stuck; bring a comps-based counter.
- By year 2, paydown + projected appreciation supports a ~$51k cash-out refi (75% LTV) — recoverable capital for the next deal without selling this one.
- Climate carrying-cost: severe wind risk, 99% chance of damaging wind over 30y; extreme-heat days projected 7→19/yr by 2055 (HVAC capex compounding) — expect insurance premiums to compound above CPI over the hold.
- This rent runs 32% of the median local income ($80k/yr) — at the standard rent-burdened threshold; future hikes will face affordability resistance.
Questions for listing agent
- What do current leases actually rent for vs. the listed asking? Can we see a recent rent roll and the last 12 months of T-12 income?
- Is there a deadline driving the sale (1031 exchange, divorce, estate, relocation)? That informs how much negotiation room exists.
- The area grade is low — what's the realistic commute time and amenity access for the typical tenant pool here? Any planned neighborhood developments (good or bad) we should know about?
- What's the average days-on-market for RENTAL listings here right now (not sales)? A rising rental-DOM trend means longer vacancies and softer asking-rent achievability than the comps imply.
- What's the recent tenant-quality profile in this submarket — average credit score on applications, eviction rate, late-payment / NSF rate, and stable-employment percentage? A property-management company in the area should have these aggregated.
- How much new for-sale + rental construction is in the pipeline within 1–3 miles? Heavy new supply typically softens prices + rents 12–24 months out; constrained supply supports both.
CashFlowRE · CFR-RCT8Y651Z93VE3
· Data 2 days ago
cashflowre.app · 2026-05-29