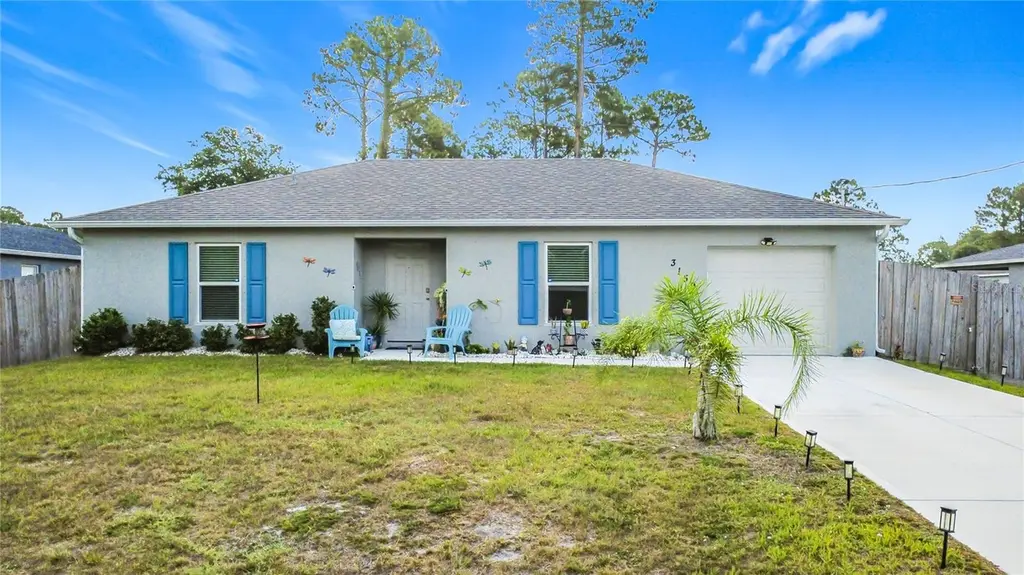
3159 Aspen Rd · Palm Bay, FL
Flood risk 1/10 · Minimal
- FEMA flood zone
- X (shaded)
- Chance of flooding over 30 yrs
- 0.0%
- Est. flood insurance / yr
- $507 – $1,088
Fire risk 3/10 · Minor
- Est. fire insurance / yr
- $947 – $1,759
Heat risk 9/10 · Severe
- Hot days now (above 106°F)
- 7 days/yr
- Hot days in 30 yrs
- 19 days/yr
Wind risk 10/10 · Severe
- Chance of severe wind over 30 yrs
- 99.0%
Air-quality risk 1/10 · Minimal
- Unhealthy air days now
- 0 days/yr
- Unhealthy air days in 30 yrs
- 0 days/yr
Risk factors via First Street. Map © Google.
Why this score? — see what drove the D+ grade
The composite is a weighted blend of 9 inputs, each scored 0–100. Each bar is that input's sub-score; the figure is the points it added to the 100-point composite (weight × sub-score).
- Cash flow +10.7/30.0
- Appreciation +10.0/10.0
- ARV discount +7.5/15.0
- Schools +4.7/10.0
- Livability +3.6/5.0
- Rent growth +3.4/5.0
- DSCR +3.1/10.0
- Condition / age +2.5/5.0
- 1% rule +2.1/10.0
$294,500
🖨 Deal sheet 📄 Offer letter ✓ Due diligence
Listing remarks MLS
Check out this Solar Energy home that was built in 2023! This is a 2 Bedroom 2 Bath home that the owner has added many desirable features. Walk into the 20 ft Living Room and you immediately see that this is an open concept home. The Living Room flows into the Dining Room. The Kitchen is wide open and has a large Peninsula with a Breakfast Bar. It also has a lot of natural light due to the Sliding Glass Doors that lead out to the Fully Fenced in Yard. The Main Bedroom has a private bathroom with a walk-in shower and has a large walk-in closet. The Owner Installed Gutters, Greenhouse, Shed, Laminate Flooring, Fencing, and Reverse Osmosis Water Treatment System. You must put this home on your must-see list! This home is Move in Ready and needs Nothing and is under $300000!!
Key facts
- Solar energy home
- Natural light
- Large peninsula
Tags
Property features AI
Finance
- Other: Public maintained asphalt road access; Zoned residential (RES); One well and one septic on property
- HOA & community: No HOA/association
Exterior
- Parking: Attached garage (1 car)
- Utilities: Well water; Septic tank; Electricity connected; Water connected; Phone available
- Home design: Single-family residence; One story; West-facing; Completed/ready condition; Homestead exempt
- Construction: Block construction; Shingle roof; Slab foundation; Built on a 0.23-acre lot
- Exterior features: Sliding doors; Wood fencing; Greenhouse; Shed(s)
Interior
- Kitchen: Dishwasher; Range; Microwave; Refrigerator; Electric water heater
- Bedrooms: 3 bedrooms
- Flooring: Laminate
- Bathrooms: 2 full bathrooms
- Heating & cooling: Central heating (electric and solar-capable); Central air conditioning
- Interior features: Ceiling fans; Open floorplan; Thermostat; Walk-in closet(s)
- Laundry & utility: Inside laundry; Washer; Dryer
Neighborhood map
What this means for you Summary
Snapshot
- This is a 3-bed/2.0-bath single-family listed at $294k.
Deal economics
- At list price, monthly cash flow is $-138 ($-2k/yr) — negative.
- To cash-flow at today's rent, offer at most $270k (8.3% below list).
- To meet the 1% rule (rent ≥ 1% of price), the offer needs to be $210k (28.7% below list).
- Recommended offer: $210k (28.7% below list) — sets the bar for 1% rule.
Location & tenants
- Location reads 72/100 on livability (#366 in FL) — a middle-class / working-renter tenant base. Strengths: cost of living A+, housing A+; Watch: schools C-, employment D+, amenities F.
- Brevard (suburban): math 53% / reading 57% proficiency, ranked #19 of 73 in FL (top 26%) — acceptable for families but not a draw, mixed tenant base, ~2y average lease.
- Market conditions: Rents rising (+3.7%/yr); 1111 active listings in the ZIP; 4 comparable units currently listed for rent nearby; rentals at typical pace (median 24d on market — plan ~3-4 weeks tenant-placement turnaround); solid renter incomes; 4,602 units permitted in Brevard County in 2024 (702 in 5+ unit buildings).
- This rent runs 32% of the median local income ($80k/yr) — at the standard rent-burdened threshold; future hikes will face affordability resistance.
Forward outlook
- In year one you build about $31k of equity ($2k loan paydown + $29k appreciation (10.0% local appreciation)).
- Brevard County population projected at +15% by 2050 — modest demand growth; plan on rents tracking national, not racing it.
- By year 2, paydown + projected appreciation supports a ~$51k cash-out refi (75% LTV) — recoverable capital for the next deal without selling this one.
Negotiation context
- It's been on market 20 days — a 2% lower offer ($290k) is reasonable based on typical stale-listing flexibility.
- 10 sale attempts since 20y ago with the ask held roughly flat each time — persistent listings suggest the price (not the market) is what's stuck; bring a comps-based counter.
Risks & watch-outs
- Climate carrying-cost: severe wind risk, 99% chance of damaging wind over 30y; extreme-heat days projected 7→19/yr by 2055 (HVAC capex compounding) — expect insurance premiums to compound above CPI over the hold.
Questions for the listing agent
- What do current leases actually rent for vs. the listed asking? Can we see a recent rent roll and the last 12 months of T-12 income?
- Is there a deadline driving the sale (1031 exchange, divorce, estate, relocation)? That informs how much negotiation room exists.
- The area grade is low — what's the realistic commute time and amenity access for the typical tenant pool here? Any planned neighborhood developments (good or bad) we should know about?
- What's the average days-on-market for RENTAL listings here right now (not sales)? A rising rental-DOM trend means longer vacancies and softer asking-rent achievability than the comps imply.
- What's the recent tenant-quality profile in this submarket — average credit score on applications, eviction rate, late-payment / NSF rate, and stable-employment percentage? A property-management company in the area should have these aggregated.
- How much new for-sale + rental construction is in the pipeline within 1–3 miles? Heavy new supply typically softens prices + rents 12–24 months out; constrained supply supports both.
Investment metrics
- 1% rule
- 0.71% ✗
- Cap rate
- 5.73%
- Cash-on-cash
- -2.01%
- DSCR
- 0.91
- GRM
- 11.7
CMA / ARV
No comps found within radius.
Projected returns pro-forma
10.0% appreciation · 3.67% rent growth · sell at horizon
- IRR
- 23.0%
- Equity multiple
- 2.85×
- Total profit
- $152,927
- Equity at exit
- $265,309
- IRR
- 20.7%
- Equity multiple
- 6.58×
- Total profit
- $459,991
- Equity at exit
- $572,149
Cash invested: $82,460 (down + closing). Projections, not guarantees.
Landlord ↔ Tenant lean methodology
- Overall (STATE)
- 87 Strongly Landlord-Friendly
- State Florida
- 87 Strongly Landlord-Friendly · R+3
- County
- — inherits STATE
- City
- — inherits STATE
ZIP-level market 32909
- Home prices YoY
- 6.0%
- Rents YoY
- 3.7%
- Active inventory
- 1111
- Price-to-rent
- 11.7×
Monthly cashflow live
- Estimated rent
- $2,100 medium interval (Pro) →
- Mortgage (P&I)
- −$1,544
- Tax from tax record
- −$130 /mo · $1,561/yr
- Insurance
- −$123
- HOA
- −$0
- Vacancy / Maint / Mgmt
- −$441
- Net cashflow
- $-138
Break-even live
UW: 25.0% down · 7.5% · 30yr · 1.5% tax · 5.0% vac · 8.0% maint · 8.0% mgmt
Financing live
Cash to close
- Down payment
- $73,625
- Closing costs
- $8,835
- Reserves months
- —
- Total cash needed
- —
Loan-product check · same deal, 3 products live
Conventional
25% down · 7.5% · 30yr
- Down + closing
- —
- Monthly P&I
- —
- Monthly cashflow
- —
- DSCR
- —
- Eligible?
- —
Personal DTI + credit; lowest rate.
DSCR
20% down · 8.5% · 30yr
- Down + closing
- —
- Monthly P&I
- —
- Monthly cashflow
- —
- DSCR
- —
- Eligible?
- —
No personal income docs; deal must DSCR.
Hard money
10% down · 12.0% · 12mo
- Down + closing
- —
- Monthly P&I
- —
- Monthly cashflow
- —
- DSCR
- —
- Eligible?
- —
Short-term bridge; refi at stabilization.
Rent comps 4 comps
| Address | Beds | Baths | Sqft | Rent | $/sqft | DOM | Units | Dist |
|---|---|---|---|---|---|---|---|---|
| 238 Silver Frost St SE Palm Bay, FL | 3.0 | 2.0 | 1475 | $1,849 | $1.25 | 23d | 1 | 0.24mi |
| 3219 Hainsworth Ave SE Palm Bay, FL | 3.0 | 2.0 | 1219 | $2,100 | $1.72 | 14d | 1 | 0.42mi |
| 2785 Gabboys Ave SE Palm Bay, FL | 3.0 | 2.0 | 1475 | $1,849 | $1.25 | 23d | 1 | 0.80mi |
| 2749 Freehold Ave SE Palm Bay, FL | 3.0 | 2.0 | 1386 | $1,800 | $1.30 | 23d | 1 | 0.88mi |
Listing history 16 events
-
2026-06-18days on market $294,500 Active 20 DOM
-
2026-06-17days on market $294,500 Active 19 DOM
-
2026-06-16days on market $294,500 Active 18 DOM
-
2026-06-15days on market $294,500 Active 17 DOM
-
2026-06-14days on market $294,500 Active 15 DOM
-
2026-06-10days on market $294,500 Active 12 DOM
-
2026-06-09price $294,500 Active 10 DOM
-
2026-06-08days on market $299,500 Active 10 DOM
-
2026-06-07days on market $299,500 Active 9 DOM
-
2026-06-05days on market $299,500 Active 6 DOM
-
2026-06-03days on market $299,500 Active 5 DOM
-
2026-06-02days on market $299,500 Active 4 DOM
-
2026-06-01days on market $299,500 Active 3 DOM
-
2026-05-31days on market $299,500 Active 2 DOM
-
2026-05-31remarks 699-char remark
-
2026-05-31$299,500 Active 1 DOM
ⓘ Source: listings_history table (triggers on properties + properties_extension) + one-shot
backfill from property_details.listing_events for pre-trigger history.
Tax reassessment forecast FL · Resets to sale price
- Current annual tax
- $1,561 · $130/mo
- Projected year-2 tax
- $2,444 · $204/mo
- Expected delta
- +$883/yr (+$74/mo · 56.6%)
ⓘ Screening estimate from a state-policy table — verify with the county assessor before closing.
Climate risk First Street
- Flood 1/10 Low FEMA zone X (shaded) · 0% chance over 30 yrs
- Wildfire 3/10 Moderate
- Heat 9/10 Extreme 7 d/yr ≥106°F today · 19 d/yr by 30 yrs out
- Wind 10/10 Extreme 99% chance of damaging wind over 30 yrs
- Air quality 1/10 Low 0 unhealthy d/yr today · 0 by 30 yrs out
Nearby sold comps map
Loading sold comps map…
Walkable amenities ~0.75 mi
Loading nearby amenities…
Taxation est. · year 1
- Rental income
- $25,206
- − Mortgage interest
- −$16,497
- − Property taxes
- −$1,561
- − Insurance
- −$1,472
- − Repairs & maintenance
- −$2,016
- − Management
- −$2,016
- − Depreciation
- −$8,567
- Taxable loss
- −$6,924
- Est. tax savings @ 24.0%
- +$1,662
- After-tax cash flow
- $8/yr
For passive investors: Depreciation is non-cash, so a rental often shows a tax loss while cash-flowing — sheltering income. Rental losses are passive: they offset passive income freely, and up to $25,000/yr can offset ordinary (W-2) income if you actively participate and your MAGI is under $100k (phasing out to $0 by $150k); unused losses carry forward. On sale, claimed depreciation is recaptured at up to 25%, and gains may owe capital-gains tax (a 1031 exchange can defer both). Figures are a year-1 estimate at your 24.0% rate — not tax advice; consult a CPA.
Schools (NCES district)
- District
- Brevard
- NCES district ID
- 1200150
- Math proficiency
- 53% ▼ -9.00%
- Reading proficiency
- 57% ▼ -4.00%
- Median HH income
- $49,426
- Composite
- 46.86/100
- National rank
- #2370
- State rank
- #19 of 73 in FL
Livability — Palm Bay
- Score
- 72/100
- State rank
- #366
- US rank
- #6458
Category grades
Schools grade is shown separately in the Schools card above.
Census & demographics
- Census place
- Palm Bay, FL
- County
- Brevard County · 602,871 people
- City population
- 132,211
- Metro
- Palm Bay-Melbourne-Titusville, FL
- Population (ZIP)
- 41,804
- Household income
- $79,977
- Rent vs Own
- Severe rent burden
- 697.0
Population outlook (Brevard County) Hauer SSP2
- Today (2025)
- 623,254 people
- By 2030
- 648,420 · +4.0%
- By 2040
- 690,009 · +10.7%
- By 2050
- 715,669 · +14.8%
- By 2075
- 775,744 · +24.5%
- By 2100
- 776,687 · +24.6%
Race, ethnicity, and origin ACS 2023
- Neighborhood character
- Diverse neighborhood (Simpson 0.70)
- Race & ethnicity
- White 46% Black 21% Hispanic / Latino 20% Two or more races 16% Asian 4%
- Hispanic origin (detail)
- Mexican 2% Puerto Rican 8% Cuban 5%
- Common ancestry
- Hispanic 3% Slovak 2% Lithuanian 2%
- Foreign-born
- 17% · Canada, China, Jamaica
- Languages at home
- 84% English-only · Spanish 9% French/Haitian/Cajun 4% Chinese 1%
Political lean MEDSL · Brevard
- 2024 margin
- Strong R (+20.8) · D 39.1% · R 59.9% · Other 1.0%
- 2008→2024 swing
- -10.4pp toward R · 2008: -10.4pp · 2024: -20.8pp
- All cycles
- 2024: R+20.8 2020: R+16.4 2016: R+19.8 2012: R+12.7 2008: R+10.4
Not yet ingested
- Civics
- —
Market trends
- HPI YoY
- ▲ 18.81%
- Current HPI
- 330.8595
- Rent YoY
- ▲ 3.67%
- Metro
- Palm Bay-Melbourne-Titusville, FL
- State GDP YoY
- ▲ 3.28%
- F500 in state
- 36
Industry mix (Fortune 500 HQ in FL)
| Industry | F500 HQs | Revenue |
|---|---|---|
| Industrial Technology | 2 | $29B |
|
||
| Insurance | 2 | $17B |
|
||
| Retail | 1 | $60B |
|
||
| Technology Distribution | 1 | $58B |
|
||
| Homebuilding | 1 | $35B |
|
||
| Technology Manufacturing | 1 | $35B |
|
||
Price history
+667.9% since first listed27 events — show timeline
- 2026-05-29 Listed $299,500 Daytona MLS
- 2026-05-29 Listed $299,500 Stellar MLS as Distributed by MLS Grid
- 2023-09-28 Sold (MLS) $265,990 SCMLS
- 2023-08-07 Pending — SCMLS
- 2023-06-17 Price Changed $265,990 SCMLS
- 2023-05-10 Listed $270,990 SCMLS
- 2022-11-03 Sold (Public Records) $25,000 Public Records
- 2022-11-03 Sold (MLS) $25,000 Beaches MLS
- 2022-10-15 Pending — Beaches MLS
- 2022-08-05 Listed $25,000 Beaches MLS
- 2021-06-11 Sold (Public Records) $17,000 Public Records
- 2021-06-04 Sold (MLS) $17,000 RAIRCMLS
- 2021-06-04 Sold (MLS) $17,000 Beaches MLS
- 2021-06-04 Sold (MLS) $17,000 SCMLS
- 2021-05-06 Pending — Beaches MLS
- 2021-05-06 Pending — SCMLS
- 2021-05-06 Pending — RAIRCMLS
- 2021-05-04 Listed $15,500 RAIRCMLS
- 2021-05-04 Listed $15,500 Beaches MLS
- 2021-05-04 Listed $15,500 SCMLS
- 2019-04-26 Listing Removed — SCMLS
- 2018-04-23 Listed $10,000 SCMLS
- 2016-08-16 Listing Removed — SCMLS
- 2016-08-16 Listing Removed — SCMLS
- 2010-04-27 Sold (Public Records) $5,500 Public Records
- 2010-03-23 Listed $4,800 SCMLS
- 2006-04-17 Listed $39,000 SCMLS
Property tax history
+30.3%/yrLatest (2025): $1,561 · +3.0% YoY. Source: county tax records.
Cash-flow waterfall
monthlySold comps — $/sqft
last 12 mo · ≤1 miLoading sold comps…