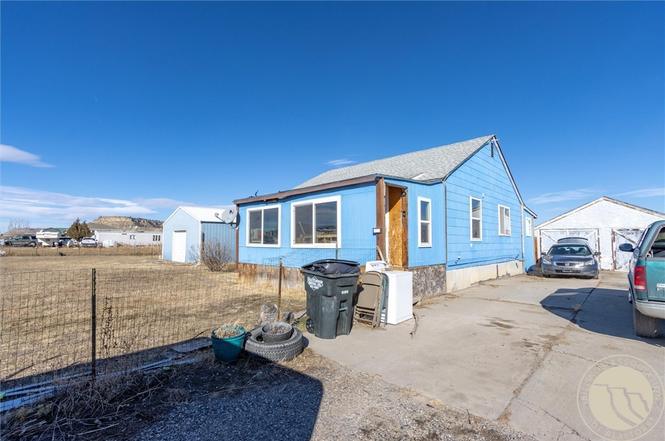
7809 Lewis Ave Ave
Billings, MT 59106
$225,000D-
2 bd · 1.0 ba ·
1,120 sqft ·
Built 1948
· SingleFamily
· Active
· 102 DOM
Cashflow @ list (25.0% down · 7.5%)
Estimated rent
$1,681/mo
Mortgage (P&I)
−$1,180
Tax + insurance
−$167
HOA
−$0
Vac / Maint / Mgmt
−$353
Net cashflow
$-19/mo
Annual
$-232/yr
Cap rate
6.19%
Cash-on-cash
-0.37%
DSCR
0.98
1% rule
0.75%
Cash to close
$63,000
Investor read
- This is a 2-bed/1.0-bath single-family listed at $225k.
- At list price, monthly cash flow is $-19 ($-232/yr) — negative.
- To cash-flow at today's rent, offer at most $222k (1.5% below list).
- To meet the 1% rule (rent ≥ 1% of price), the offer needs to be $168k (25.3% below list).
- It's been on market 102 days — a 9% lower offer ($205k) is reasonable based on typical stale-listing flexibility.
- Recommended offer: $168k (25.3% below list) — sets the bar for 1% rule.
- Local home prices are declining (-3.0%/yr); year-one equity from $2k of loan paydown is wiped out by about $7k of value loss. Plan a longer hold.
- Location reads 80/100 on livability (#10 in MT, #1,830 nationally) — a professional / high-income tenant draw. Strengths: amenities A+, commute A+, housing A+; Watch: crime F.
- Elder Grove Elementary (rural): math 34% / reading 45% proficiency, ranked #54 of 116 in MT (top 47%) — families likely to look elsewhere, expect single-tenant / working-renter base with shorter leases; only 15% free/reduced lunch — higher-income household profile.
- Zoned schools: Elder Grove School (math 47% / reading 47%, grade D-, #101 of 293 statewide, top 39%, 458 students, 0% FRL); Elder Grove 7-8 (math 23% / reading 43%, grade F, #97 of 146 statewide, top 66%, 231 students, 0% FRL) — zoned schools average 0% FRL vs 15% district-wide (15 pts lower); this property's tenant base skews higher-income than the district average.
- Watch-outs: built in 1948 — expect roof / HVAC / electrical / plumbing capex.
- Market conditions: Rents rising (+3.4%/yr); 414 active listings in the ZIP; high-income renter base; 1,401 units permitted in Yellowstone County in 2024 (281 in 5+ unit buildings).
- Yellowstone County population projected at +26% by 2050 — long-run rental-demand tailwind backs the buy-and-hold thesis.
- Climate carrying-cost: major wildfire risk — expect insurance premiums to compound above CPI over the hold.
- Cap rate 6.2% vs local median 3.0% in Billings — top-decile yield for the area; either an underpriced asset or a hidden risk that comps aren't pricing in. Stress-test before assuming the spread holds.
- This rent is only 16% of the median local income ($126k/yr) — well below the 30% rent-burden line; pricing power to push rent on renewal without tenant pushback.
Questions for listing agent
- What do current leases actually rent for vs. the listed asking? Can we see a recent rent roll and the last 12 months of T-12 income?
- It's been on market 102 days. Have you received any prior offers? Is the seller open to a 25% concession, seller financing, or rate buy-down credit?
- Built in 1948 — when were the roof, HVAC, electrical panel, plumbing, and water heater last replaced?
- Why hasn't it sold? Are there any deal-killer items the seller is aware of (foundation, flood, title, zoning, code violations)?
- Is there a deadline driving the sale (1031 exchange, divorce, estate, relocation)? That informs how much negotiation room exists.
- Schools are D-rated, which usually means shorter tenancies and higher turnover. Who's the typical renter profile here, and what's been the actual vacancy rate?
- Crime grade is F in this area — have there been break-ins, vandalism, or insurance claims at this property in the last 3 years? What carrier currently insures it and at what premium?
- The area grade is low — what's the realistic commute time and amenity access for the typical tenant pool here? Any planned neighborhood developments (good or bad) we should know about?
CashFlowRE · CFR-RD0ENSBTYH1PFA
· Data 1 day ago
cashflowre.app · 2026-05-29