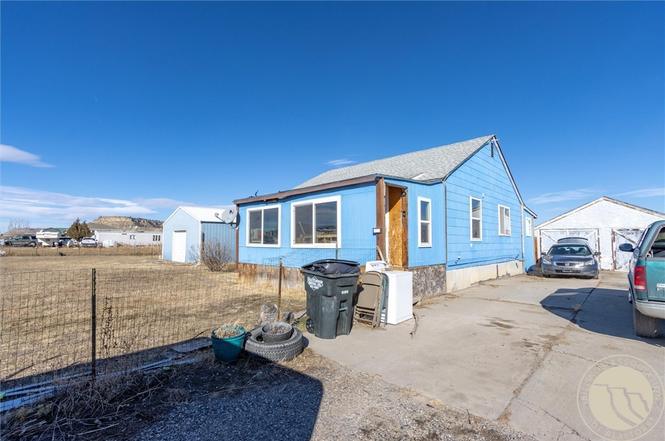
7809 Lewis Ave Ave · Billings, MT
Flood risk 1/10 · Minimal
- FEMA flood zone
- X (unshaded)
- Chance of flooding over 30 yrs
- 0.0%
- Est. flood insurance / yr
- $473 – $860
Fire risk 7/10 · Major
- Est. fire insurance / yr
- $918 – $1,706
Heat risk 3/10 · Minor
- Hot days now (above 94°F)
- 7 days/yr
- Hot days in 30 yrs
- 16 days/yr
Wind risk 1/10 · Minimal
- Chance of severe wind over 30 yrs
- —
Air-quality risk 4/10 · Minor
- Unhealthy air days now
- 4 days/yr
- Unhealthy air days in 30 yrs
- 5 days/yr
Risk factors via First Street. Map © Google.
Why this score? — see what drove the D- grade
The composite is a weighted blend of 9 inputs, each scored 0–100. Each bar is that input's sub-score; the figure is the points it added to the 100-point composite (weight × sub-score).
- Cash flow +12.8/30.0
- ARV discount +7.5/15.0
- Livability +4.0/5.0
- DSCR +3.8/10.0
- Schools +3.5/10.0
- Rent growth +3.4/5.0
- 1% rule +2.5/10.0
- Condition / age +2.5/5.0
- Appreciation +0.0/10.0
$225,000
🖨 Deal sheet 📄 Offer letter ✓ Due diligence
Key facts
- Two lots
- Great layout
- Closed front porch
Tags
Property features AI
Exterior
- Parking: Detached oversized garage with workshop; Two covered garage spaces; Additional parking
- Utilities: Private water (cistern); Private sewer (septic tank)
- Home design: Single-family residence; Two levels
- Construction: Asphalt shingle roof
- Exterior features: Deck; Covered patio; Front porch; Patio; Fenced yard; Landscaped, level interior lot
Interior
- Kitchen: Electric Range, Gas Range, Oven, Microwave, Refrigerator
- Bedrooms: Two main-level bedrooms
- Bathrooms: One full bathroom on the main level
- Heating & cooling: Electric heating; Propane heating; Window unit cooling
- Interior features: Electric and gas range, oven, microwave, and refrigerator included; Full basement
- Laundry & utility: Has basement (utility space available)
Neighborhood map
What this means for you Summary
Snapshot
- This is a 2-bed/1.0-bath single-family listed at $225k.
Deal economics
- At list price, monthly cash flow is $-19 ($-232/yr) — negative.
- To cash-flow at today's rent, offer at most $222k (1.5% below list).
- To meet the 1% rule (rent ≥ 1% of price), the offer needs to be $168k (25.3% below list).
- Recommended offer: $168k (25.3% below list) — sets the bar for 1% rule.
- Cap rate 6.2% vs local median 3.0% in Billings — top-decile yield for the area; either an underpriced asset or a hidden risk that comps aren't pricing in. Stress-test before assuming the spread holds.
Location & tenants
- Location reads 80/100 on livability (#10 in MT, #1,830 nationally) — a professional / high-income tenant draw. Strengths: amenities A+, commute A+, housing A+; Watch: crime F.
- Elder Grove Elementary (rural): math 34% / reading 45% proficiency, ranked #54 of 116 in MT (top 47%) — families likely to look elsewhere, expect single-tenant / working-renter base with shorter leases; only 15% free/reduced lunch — higher-income household profile.
- Zoned schools: Elder Grove School (math 47% / reading 47%, grade D-, #101 of 293 statewide, top 39%, 458 students, 0% FRL); Elder Grove 7-8 (math 23% / reading 43%, grade F, #97 of 146 statewide, top 66%, 231 students, 0% FRL) — zoned schools average 0% FRL vs 15% district-wide (15 pts lower); this property's tenant base skews higher-income than the district average.
- Market conditions: Rents rising (+3.4%/yr); 414 active listings in the ZIP; high-income renter base; 1,401 units permitted in Yellowstone County in 2024 (281 in 5+ unit buildings).
- This rent is only 16% of the median local income ($126k/yr) — well below the 30% rent-burden line; pricing power to push rent on renewal without tenant pushback.
Forward outlook
- Local home prices are declining (-3.0%/yr); year-one equity from $2k of loan paydown is wiped out by about $7k of value loss. Plan a longer hold.
- Yellowstone County population projected at +26% by 2050 — long-run rental-demand tailwind backs the buy-and-hold thesis.
Negotiation context
- It's been on market 102 days — a 9% lower offer ($205k) is reasonable based on typical stale-listing flexibility.
Risks & watch-outs
- Watch-outs: built in 1948 — expect roof / HVAC / electrical / plumbing capex.
- Climate carrying-cost: major wildfire risk — expect insurance premiums to compound above CPI over the hold.
Questions for the listing agent
- What do current leases actually rent for vs. the listed asking? Can we see a recent rent roll and the last 12 months of T-12 income?
- It's been on market 102 days. Have you received any prior offers? Is the seller open to a 25% concession, seller financing, or rate buy-down credit?
- Built in 1948 — when were the roof, HVAC, electrical panel, plumbing, and water heater last replaced?
- Why hasn't it sold? Are there any deal-killer items the seller is aware of (foundation, flood, title, zoning, code violations)?
- Is there a deadline driving the sale (1031 exchange, divorce, estate, relocation)? That informs how much negotiation room exists.
- Schools are D-rated, which usually means shorter tenancies and higher turnover. Who's the typical renter profile here, and what's been the actual vacancy rate?
- Crime grade is F in this area — have there been break-ins, vandalism, or insurance claims at this property in the last 3 years? What carrier currently insures it and at what premium?
- The area grade is low — what's the realistic commute time and amenity access for the typical tenant pool here? Any planned neighborhood developments (good or bad) we should know about?
- What's the average days-on-market for RENTAL listings here right now (not sales)? A rising rental-DOM trend means longer vacancies and softer asking-rent achievability than the comps imply.
- What's the recent tenant-quality profile in this submarket — average credit score on applications, eviction rate, late-payment / NSF rate, and stable-employment percentage? A property-management company in the area should have these aggregated.
- How much new for-sale + rental construction is in the pipeline within 1–3 miles? Heavy new supply typically softens prices + rents 12–24 months out; constrained supply supports both.
Investment metrics
- 1% rule
- 0.75% ✗
- Cap rate
- 6.19%
- Cash-on-cash
- -0.37%
- DSCR
- 0.98
- GRM
- 11.2
CMA / ARV
No comps found within radius.
Projected returns pro-forma
-3.0% appreciation · 3.42% rent growth · sell at horizon
- IRR
- -16.6%
- Equity multiple
- 0.41×
- Total profit
- $-37,080
- Equity at exit
- $33,548
- IRR
- -7.8%
- Equity multiple
- 0.50×
- Total profit
- $-31,338
- Equity at exit
- $19,454
Cash invested: $63,000 (down + closing). Projections, not guarantees.
Landlord ↔ Tenant lean methodology
- Overall (STATE)
- 82 Strongly Landlord-Friendly
- State Montana
- 82 Strongly Landlord-Friendly · R+11
- County
- — inherits STATE
- City
- — inherits STATE
ZIP-level market 59106
- Rents YoY
- 3.4%
- Active inventory
- 414
- Price-to-rent
- 11.2×
Monthly cashflow live
- Estimated rent
- $1,681 medium interval (Pro) →
- Mortgage (P&I)
- −$1,180
- Tax from tax record
- −$74 /mo · $882/yr
- Insurance
- −$94
- HOA
- −$0
- Vacancy / Maint / Mgmt
- −$353
- Net cashflow
- $-19
Break-even live
UW: 25.0% down · 7.5% · 30yr · 1.5% tax · 5.0% vac · 8.0% maint · 8.0% mgmt
Financing live
Cash to close
- Down payment
- $56,250
- Closing costs
- $6,750
- Reserves months
- —
- Total cash needed
- —
Loan-product check · same deal, 3 products live
Conventional
25% down · 7.5% · 30yr
- Down + closing
- —
- Monthly P&I
- —
- Monthly cashflow
- —
- DSCR
- —
- Eligible?
- —
Personal DTI + credit; lowest rate.
DSCR
20% down · 8.5% · 30yr
- Down + closing
- —
- Monthly P&I
- —
- Monthly cashflow
- —
- DSCR
- —
- Eligible?
- —
No personal income docs; deal must DSCR.
Hard money
10% down · 12.0% · 12mo
- Down + closing
- —
- Monthly P&I
- —
- Monthly cashflow
- —
- DSCR
- —
- Eligible?
- —
Short-term bridge; refi at stabilization.
Listing history 20 events
-
2026-06-19days on market $225,000 Active 102 DOM
-
2026-06-18days on market $225,000 Active 101 DOM
-
2026-06-17days on market $225,000 Active 100 DOM
-
2026-06-16days on market $225,000 Active 99 DOM
-
2026-06-15days on market $225,000 Active 98 DOM
-
2026-06-14days on market $225,000 Active 96 DOM
-
2026-06-13days on market $225,000 Active 95 DOM
-
2026-06-10days on market $225,000 Active 93 DOM
-
2026-06-09days on market $225,000 Active 92 DOM
-
2026-06-08days on market $225,000 Active 91 DOM
-
2026-06-07days on market $225,000 Active 90 DOM
-
2026-06-05days on market $225,000 Active 87 DOM
-
2026-06-03days on market $225,000 Active 86 DOM
-
2026-06-02days on market $225,000 Active 85 DOM
-
2026-06-01days on market $225,000 Active 84 DOM
-
2026-05-31days on market $225,000 Active 83 DOM
-
2026-05-30days on market $225,000 Active 82 DOM
-
2026-04-27price $225,000
-
2026-04-01price $250,000
-
2026-03-09$260,000 Active
ⓘ Source: listings_history table (triggers on properties + properties_extension) + one-shot
backfill from property_details.listing_events for pre-trigger history.
Tax reassessment forecast MT · Resets to sale price
- Current annual tax
- $882 · $74/mo
- Projected year-2 tax
- $1,890 · $157/mo
- Expected delta
- +$1,008/yr (+$84/mo · 114.3%)
ⓘ Screening estimate from a state-policy table — verify with the county assessor before closing.
Climate risk First Street
- Flood 1/10 Low FEMA zone X (unshaded) · 0% chance over 30 yrs
- Wildfire 7/10 Severe
- Heat 3/10 Moderate 7 d/yr ≥94°F today · 16 d/yr by 30 yrs out
- Wind 1/10 Low
- Air quality 4/10 Moderate 4 unhealthy d/yr today · 5 by 30 yrs out
Nearby sold comps map
Loading sold comps map…
Walkable amenities ~0.75 mi
Loading nearby amenities…
Taxation est. · year 1
- Rental income
- $20,170
- − Mortgage interest
- −$12,603
- − Property taxes
- −$882
- − Insurance
- −$1,125
- − Repairs & maintenance
- −$1,614
- − Management
- −$1,614
- − Depreciation
- −$6,545
- Taxable loss
- −$4,213
- Est. tax savings @ 24.0%
- +$1,011
- After-tax cash flow
- $779/yr
For passive investors: Depreciation is non-cash, so a rental often shows a tax loss while cash-flowing — sheltering income. Rental losses are passive: they offset passive income freely, and up to $25,000/yr can offset ordinary (W-2) income if you actively participate and your MAGI is under $100k (phasing out to $0 by $150k); unused losses carry forward. On sale, claimed depreciation is recaptured at up to 25%, and gains may owe capital-gains tax (a 1031 exchange can defer both). Figures are a year-1 estimate at your 24.0% rate — not tax advice; consult a CPA.
Schools (NCES district)
- District
- Elder Grove Elementary
- NCES district ID
- 3009720
- Math proficiency
- 34% ▼ -1.00%
- Reading proficiency
- 45% ▼ -6.00%
- Median HH income
- $58,421
- Composite
- 34.84/100
- National rank
- #5095
- State rank
- #54 of 116 in MT
Livability — Billings
- Score
- 80/100
- State rank
- #10
- US rank
- #1830
Category grades
Schools grade is shown separately in the Schools card above.
Census & demographics
- County
- Yellowstone County · 159,426 people
- City population
- 147,124
- Metro
- Billings, MT
- Population (ZIP)
- 21,417
- Household income
- $125,833
- Rent vs Own
- Severe rent burden
- 243.0
Population outlook (Yellowstone County) Hauer SSP2
- Today (2025)
- 176,227 people
- By 2030
- 185,619 · +5.3%
- By 2040
- 203,543 · +15.5%
- By 2050
- 221,100 · +25.5%
- By 2075
- 266,931 · +51.5%
- By 2100
- 301,141 · +70.9%
Race, ethnicity, and origin ACS 2023
- Neighborhood character
- Predominantly White (87%)
- Race & ethnicity
- White 87% Two or more races 5% Hispanic / Latino 4% Native American 1%
- Common ancestry
- Portuguese 12% Lithuanian 2% Italian 2%
- Foreign-born
- 2% · Canada
- Languages at home
- 96% English-only · French/Haitian/Cajun 2% Spanish 1%
Political lean MEDSL · Yellowstone
- 2024 margin
- Strong R (+27.1) · D 34.9% · R 62.0% · Other 3.1%
- 2008→2024 swing
- -20.8pp toward R · 2008: -6.3pp · 2024: -27.1pp
- All cycles
- 2024: R+27.1 2020: R+24.0 2016: R+27.1 2012: R+20.6 2008: R+6.3
Not yet ingested
- Civics
- —
Market trends
- HPI YoY
- ▼ -104.18%
- Current HPI
- 186.9889
- Rent YoY
- ▲ 3.42%
- Metro
- Billings, MT
- State GDP YoY
- ▲ 3.41%
- F500 in state
- 2
Industry mix (Fortune 500 HQ in MT)
| Industry | F500 HQs | Revenue |
|---|---|---|
| Technology / Analytics | 1 | $2B |
|
||
Price history
-13.5% since first listed3 events — show timeline
- 2026-04-27 Price Changed $225,000 BMTMLS
- 2026-04-01 Price Changed $250,000 BMTMLS
- 2026-03-09 Listed $260,000 BMTMLS
Property tax history
+1.9%/yrLatest (2025): $882 · -30.9% YoY. Source: county tax records.
Cash-flow waterfall
monthlySold comps — $/sqft
last 12 mo · ≤1 miLoading sold comps…