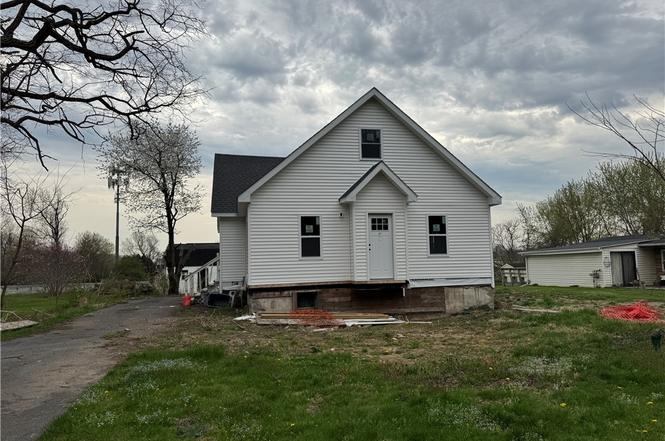
362 Long Branch Rd
Lakeland, NY 13209
$149,500B-
4 bd · 1.5 ba ·
2,224 sqft ·
Built 1930
· SingleFamily
· Pending
· 19 DOM
Cashflow @ list (25.0% down · 7.5%)
Estimated rent
$2,125/mo
Mortgage (P&I)
−$784
Tax + insurance
−$335
HOA
−$0
Vac / Maint / Mgmt
−$446
Net cashflow
$560/mo
Annual
$6,718/yr
Cap rate
10.79%
Cash-on-cash
16.05%
DSCR
1.71
1% rule
1.42%
Cash to close
$41,860
Investor read
- This is a 4-bed/1.5-bath single-family listed at $150k.
- At list price, monthly cash flow is $560 ($7k/yr) — positive.
- The deal already cash-flows at list — no discount required.
- Meets the 1% rule at list price ($2k rent vs $150k).
- It's been on market 19 days — a 2% lower offer ($147k) is reasonable based on typical stale-listing flexibility.
- Recommended offer: $147k (1.5% below list) — sets the bar for market timing.
- Local home prices are declining (-3.0%/yr); year-one equity from $1k of loan paydown is wiped out by about $4k of value loss. Plan a longer hold.
- Location reads 76/100 on livability (#219 in NY, #3,457 nationally) — a middle-class / working-renter tenant base. Strengths: employment A+, housing A+, crime A; Watch: amenities F, commute F.
- Solvay Union Free School District (suburban): math 31% / reading 42% proficiency, ranked #550 of 590 in NY (top 93%) — families likely to look elsewhere, expect single-tenant / working-renter base with shorter leases.
- Zoned schools: Solvay Elementary School (math 22% / reading 32%, grade F, #1,786 of 2,108 statewide, top 86%, 446 students, 65% FRL); Solvay Middle School (math 12% / reading 30%, grade F, #661 of 729 statewide, top 91%, 438 students, 70% FRL); Solvay High School (math 87% / reading 87%, grade A, #311 of 1,100 statewide, top 30%, 458 students, 71% FRL) — zoned schools average 69% FRL vs 46% district-wide (23 pts higher); higher-poverty schools than district average — tighter screening recommended.
- Watch-outs: built in 1930 — expect roof / HVAC / electrical / plumbing capex.
- Market conditions: 58 active listings in the ZIP; 616 units permitted in Onondaga County in 2024 (256 in 5+ unit buildings).
- Onondaga County population projected to shrink 9% by 2050 — rents likely to lag national; underwrite the cash flow, not the appreciation.
- At projected returns (-3.0% appreciation + 3.0% rent growth), your $42k cash investment doubles in ~8 years — after that, you're playing with house money.
- This rent runs 37% of the median local income ($68k/yr) — at the standard rent-burdened threshold; future hikes will face affordability resistance.
Questions for listing agent
- Built in 1930 — when were the roof, HVAC, electrical panel, plumbing, and water heater last replaced?
- Is there a deadline driving the sale (1031 exchange, divorce, estate, relocation)? That informs how much negotiation room exists.
- What's the average days-on-market for RENTAL listings here right now (not sales)? A rising rental-DOM trend means longer vacancies and softer asking-rent achievability than the comps imply.
- What's the recent tenant-quality profile in this submarket — average credit score on applications, eviction rate, late-payment / NSF rate, and stable-employment percentage? A property-management company in the area should have these aggregated.
- How much new for-sale + rental construction is in the pipeline within 1–3 miles? Heavy new supply typically softens prices + rents 12–24 months out; constrained supply supports both.
CashFlowRE · CFR-RD6HKJ8F9BDACY
· Data 4 weeks ago
cashflowre.app · 2026-05-29