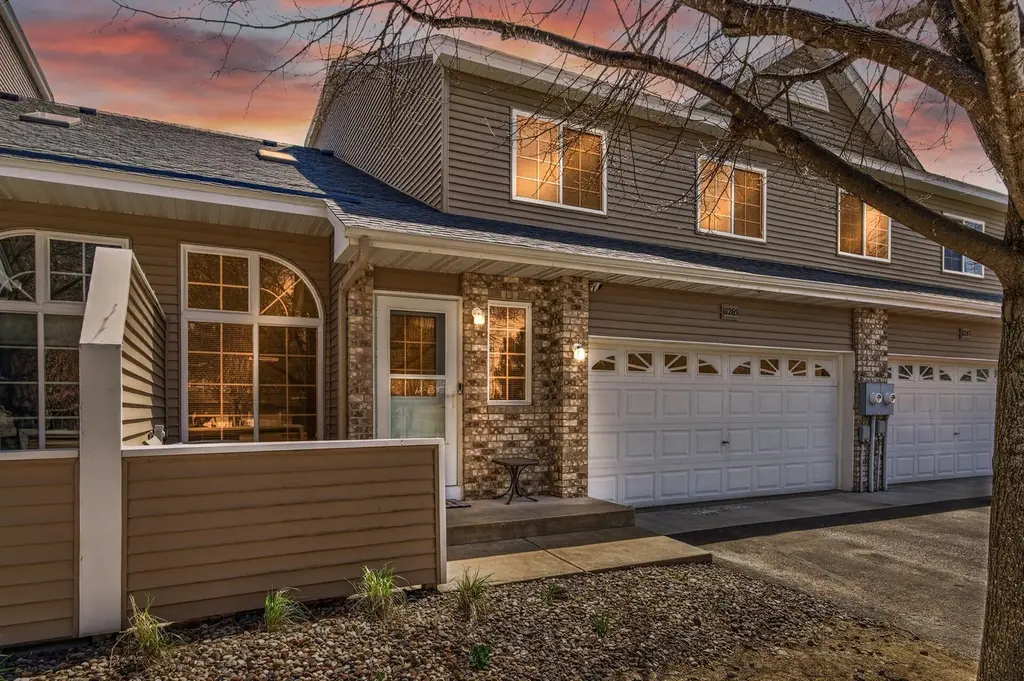
11265 16th St NE
St. Michael, MN 55376
$289,900D
3 bd · 1.0 ba ·
1,945 sqft ·
Built 2005
· SingleFamily
· Active
· 48 DOM
Cashflow @ list (25.0% down · 7.5%)
Estimated rent
$2,263/mo
Mortgage (P&I)
−$1,520
Tax + insurance
−$347
HOA
−$295
Vac / Maint / Mgmt
−$475
Net cashflow
$-374/mo
Annual
$-4,491/yr
Cap rate
4.74%
Cash-on-cash
-5.53%
DSCR
0.75
1% rule
0.78%
Cash to close
$81,172
Investor read
- This is a 3-bed/1.0-bath single-family listed at $290k.
- At list price, monthly cash flow is $-374 ($-4k/yr) — negative.
- To cash-flow at today's rent, offer at most $224k (22.8% below list).
- To meet the 1% rule (rent ≥ 1% of price), the offer needs to be $226k (21.9% below list).
- It's been on market 48 days — a 3% lower offer ($281k) is reasonable based on typical stale-listing flexibility.
- Recommended offer: $224k (22.8% below list) — sets the bar for cash-flow.
- Local home prices are declining (-3.0%/yr); year-one equity from $2k of loan paydown is wiped out by about $9k of value loss. Plan a longer hold.
- Location reads: area grade D — affects rentability + tenant quality, not the cash-flow math above.
- St. Michael-Albertville School District (rural): math 62% / reading 66% proficiency, ranked #17 of 301 in MN (top 6%) — acceptable for families but not a draw, mixed tenant base, ~2y average lease; only 9% free/reduced lunch — higher-income household profile.
- Market conditions: 353 active listings in the ZIP; 2 comparable units currently listed for rent nearby; high-income renter base; 1,260 units permitted in Wright County in 2024 (180 in 5+ unit buildings).
- Wright County population projected at +9% by 2050 — modest demand growth; plan on rents tracking national, not racing it.
- 2 sale attempts since 6y ago with the ask held roughly flat each time — persistent listings suggest the price (not the market) is what's stuck; bring a comps-based counter.
- Current owner paid $199k; 46% above their basis — modest negotiation headroom, anchor on the comps not their cost.
- Cap rate 4.7% vs local median 3.2% in St. Michael — top-decile yield for the area; either an underpriced asset or a hidden risk that comps aren't pricing in. Stress-test before assuming the spread holds.
Questions for listing agent
- What do current leases actually rent for vs. the listed asking? Can we see a recent rent roll and the last 12 months of T-12 income?
- It's been on market 48 days. Have you received any prior offers? Is the seller open to a 23% concession, seller financing, or rate buy-down credit?
- What does the HOA fee cover, when was the last increase, and are there any pending special assessments or reserve-fund shortfalls?
- Is there a deadline driving the sale (1031 exchange, divorce, estate, relocation)? That informs how much negotiation room exists.
- The area grade is low — what's the realistic commute time and amenity access for the typical tenant pool here? Any planned neighborhood developments (good or bad) we should know about?
- What's the average days-on-market for RENTAL listings here right now (not sales)? A rising rental-DOM trend means longer vacancies and softer asking-rent achievability than the comps imply.
- What's the recent tenant-quality profile in this submarket — average credit score on applications, eviction rate, late-payment / NSF rate, and stable-employment percentage? A property-management company in the area should have these aggregated.
- How much new for-sale + rental construction is in the pipeline within 1–3 miles? Heavy new supply typically softens prices + rents 12–24 months out; constrained supply supports both.
CashFlowRE · CFR-RD970EBTYRF82M
· Data 1 day ago
cashflowre.app · 2026-05-29