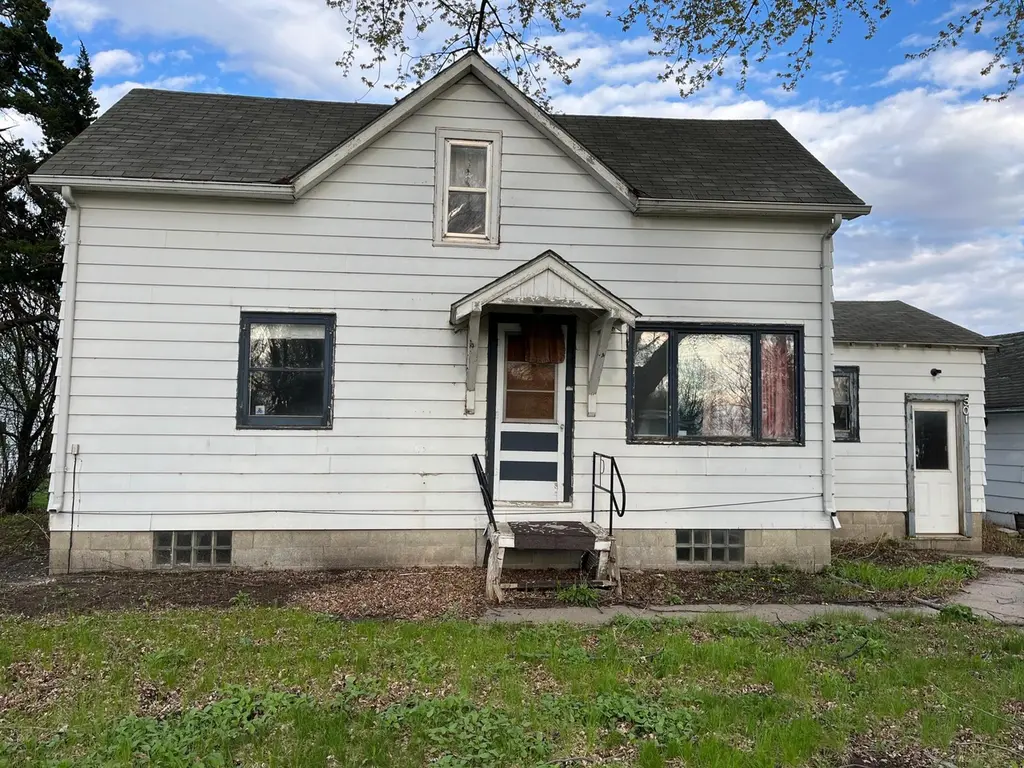
301 Main St
Lucan, MN 56255
$23,999B
2 bd · 1.0 ba ·
864 sqft ·
Built 1900
· SingleFamily
· Pending
· 20 DOM
Cashflow @ list (25.0% down · 7.5%)
Estimated rent
$855/mo
Mortgage (P&I)
−$126
Tax + insurance
−$61
HOA
−$0
Vac / Maint / Mgmt
−$180
Net cashflow
$489/mo
Annual
$5,867/yr
Cap rate
30.74%
Cash-on-cash
87.31%
DSCR
4.88
1% rule
3.56%
Cash to close
$6,720
Investor read
- This is a 2-bed/1.0-bath single-family listed at $24k.
- At list price, monthly cash flow is $489 ($6k/yr) — positive.
- The deal already cash-flows at list — no discount required.
- Meets the 1% rule at list price ($855 rent vs $24k).
- It's been on market 20 days — a 2% lower offer ($24k) is reasonable based on typical stale-listing flexibility.
- Recommended offer: $24k (1.5% below list) — sets the bar for market timing.
- In year one you build about $886 of equity ($166 loan paydown + $720 appreciation (3.0% local appreciation)).
- Location reads 62/100 on livability (#696 in MN) — a middle-class / working-renter tenant base. Strengths: cost of living A+, housing A-; Watch: employment D+, health & safety D+, crime D.
- Wabasso Public School District (rural): math 50% / reading 48% proficiency, ranked #130 of 301 in MN (top 43%) — families likely to look elsewhere, expect single-tenant / working-renter base with shorter leases; only 18% free/reduced lunch — higher-income household profile.
- Zoned schools: Wabasso Elementary (math 52% / reading 47%, grade D, #423 of 857 statewide, top 55%, 189 students, 51% FRL); Wabasso Secondary (math 47% / reading 47%, grade D-, #166 of 471 statewide, top 39%, 232 students, 44% FRL) — zoned schools average 47% FRL vs 18% district-wide (29 pts higher); higher-poverty schools than district average — tighter screening recommended.
- Watch-outs: property tax is 2.5% of price; built in 1900 — expect roof / HVAC / electrical / plumbing capex.
- Market conditions: 5 active listings in the ZIP; 25 units permitted in Redwood County in 2024 (0 in 5+ unit buildings).
- Redwood County population projected at -16% by 2050 — secular population decline; favor cash flow + early exit over multi-decade hold.
- 3 sale attempts since 16y ago with the ask held roughly flat each time — persistent listings suggest the price (not the market) is what's stuck; bring a comps-based counter.
- At projected returns (3.0% appreciation + 3.0% rent growth), your $7k cash investment doubles in ~1 year — after that, you're playing with house money.
Questions for listing agent
- Built in 1900 — when were the roof, HVAC, electrical panel, plumbing, and water heater last replaced?
- Property tax is high relative to price — has the assessment been appealed recently, and will the sale trigger a re-assessment?
- Is there a deadline driving the sale (1031 exchange, divorce, estate, relocation)? That informs how much negotiation room exists.
- Crime grade is D in this area — have there been break-ins, vandalism, or insurance claims at this property in the last 3 years? What carrier currently insures it and at what premium?
- What's the average days-on-market for RENTAL listings here right now (not sales)? A rising rental-DOM trend means longer vacancies and softer asking-rent achievability than the comps imply.
- What's the recent tenant-quality profile in this submarket — average credit score on applications, eviction rate, late-payment / NSF rate, and stable-employment percentage? A property-management company in the area should have these aggregated.
- How much new for-sale + rental construction is in the pipeline within 1–3 miles? Heavy new supply typically softens prices + rents 12–24 months out; constrained supply supports both.
CashFlowRE · CFR-REGCYNBHNMQHQQ
· Data 6 days ago
cashflowre.app · 2026-05-29