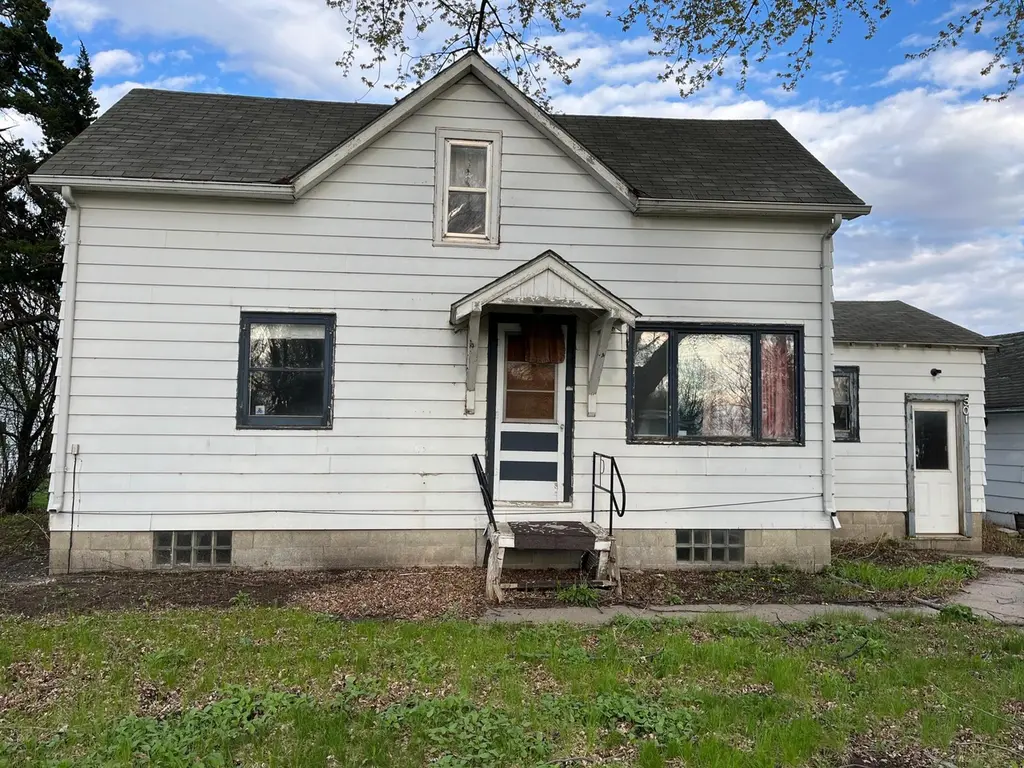
301 Main St · Lucan, MN
Flood risk No data
- FEMA flood zone
- —
- Chance of flooding over 30 yrs
- —
- Est. flood insurance / yr
- —
Fire risk No data
- Est. fire insurance / yr
- —
Heat risk No data
- Hot days now (above threshold)
- —
- Hot days in 30 yrs
- —
Wind risk No data
- Chance of severe wind over 30 yrs
- —
Air-quality risk No data
- Unhealthy air days now
- —
- Unhealthy air days in 30 yrs
- —
Risk factors via First Street. Map © Google.
Why this score? — see what drove the B grade
The composite is a weighted blend of 9 inputs, each scored 0–100. Each bar is that input's sub-score; the figure is the points it added to the 100-point composite (weight × sub-score).
- Cash flow +30.0/30.0
- 1% rule +10.0/10.0
- DSCR +10.0/10.0
- ARV discount +7.5/15.0
- Appreciation +5.0/10.0
- Schools +4.2/10.0
- Livability +3.1/5.0
- Rent growth +2.5/5.0
- Condition / age +2.5/5.0
$23,999
🖨 Deal sheet (PDF) 📄 Offer letter ✓ Due diligence
Listing remarks MLS
3 bedroom 1 1/2 story home located on Main Street of Lucan. Property is being sold ''AS IS'' with possession to be immediate.
Key facts
- 0.3 acre lot
- Garage
- Built 1900
Property features AI
Finance
- Other: Lot about 0.298 acres (approx. 100 x 130)
- Financial info: Annual taxes reported: $610 (2025)
Exterior
- Parking: Detached or attached 1-car garage (330 garage area)
- Utilities: City water connected; City sewer connected; Other fuel source
- Home design: Residential two-story; Main level finished area of 850; Total building area 1,872
- Construction: Block foundation; Foundation area 672; Two levels
- Exterior features: Other exterior features
Interior
- Bedrooms: 2 bedrooms
- Bathrooms: 1 full bathroom
- Heating & cooling: Forced air heating; Central air conditioning
- Interior features: Basement with block foundation
Neighborhood map
What this means for you Summary
Snapshot
- This is a 2-bed/1.0-bath single-family listed at $24k.
Deal economics
- At list price, monthly cash flow is $489 ($6k/yr) — positive.
- The deal already cash-flows at list — no discount required.
- Meets the 1% rule at list price ($855 rent vs $24k).
- Recommended offer: $24k (1.5% below list) — sets the bar for market timing.
Location & tenants
- Location reads 62/100 on livability (#696 in MN) — a middle-class / working-renter tenant base. Strengths: cost of living A+, housing A-; Watch: employment D+, health & safety D+, crime D.
- Wabasso Public School District (rural): math 50% / reading 48% proficiency, ranked #130 of 301 in MN (top 43%) — families likely to look elsewhere, expect single-tenant / working-renter base with shorter leases; only 18% free/reduced lunch — higher-income household profile.
- Zoned schools: Wabasso Elementary (math 52% / reading 47%, grade D, #423 of 857 statewide, top 55%, 189 students, 51% FRL); Wabasso Secondary (math 47% / reading 47%, grade D-, #166 of 471 statewide, top 39%, 232 students, 44% FRL) — zoned schools average 47% FRL vs 18% district-wide (29 pts higher); higher-poverty schools than district average — tighter screening recommended.
- Market conditions: 5 active listings in the ZIP; 25 units permitted in Redwood County in 2024 (0 in 5+ unit buildings).
Forward outlook
- In year one you build about $886 of equity ($166 loan paydown + $720 appreciation (3.0% local appreciation)).
- Redwood County population projected at -16% by 2050 — secular population decline; favor cash flow + early exit over multi-decade hold.
- At projected returns (3.0% appreciation + 3.0% rent growth), your $7k cash investment doubles in ~1 year — after that, you're playing with house money.
Negotiation context
- It's been on market 20 days — a 2% lower offer ($24k) is reasonable based on typical stale-listing flexibility.
- 3 sale attempts since 16y ago with the ask held roughly flat each time — persistent listings suggest the price (not the market) is what's stuck; bring a comps-based counter.
Risks & watch-outs
- Watch-outs: property tax is 2.5% of price; built in 1900 — expect roof / HVAC / electrical / plumbing capex.
Questions for the listing agent
- Built in 1900 — when were the roof, HVAC, electrical panel, plumbing, and water heater last replaced?
- Property tax is high relative to price — has the assessment been appealed recently, and will the sale trigger a re-assessment?
- Is there a deadline driving the sale (1031 exchange, divorce, estate, relocation)? That informs how much negotiation room exists.
- Crime grade is D in this area — have there been break-ins, vandalism, or insurance claims at this property in the last 3 years? What carrier currently insures it and at what premium?
- What's the average days-on-market for RENTAL listings here right now (not sales)? A rising rental-DOM trend means longer vacancies and softer asking-rent achievability than the comps imply.
- What's the recent tenant-quality profile in this submarket — average credit score on applications, eviction rate, late-payment / NSF rate, and stable-employment percentage? A property-management company in the area should have these aggregated.
- How much new for-sale + rental construction is in the pipeline within 1–3 miles? Heavy new supply typically softens prices + rents 12–24 months out; constrained supply supports both.
Investment metrics
- 1% rule
- 3.56% ✓
- Cap rate
- 30.74%
- Cash-on-cash
- 87.31%
- DSCR
- 4.88
- GRM
- 2.3
CMA / ARV
No comps found within radius.
Projected returns pro-forma
3.0% appreciation · 3.0% rent growth · sell at horizon
- IRR
- 91.7%
- Equity multiple
- 6.07×
- Total profit
- $34,054
- Equity at exit
- $10,791
- IRR
- 91.2%
- Equity multiple
- 12.55×
- Total profit
- $77,631
- Equity at exit
- $16,630
Cash invested: $6,720 (down + closing). Projections, not guarantees.
Landlord ↔ Tenant lean methodology
- Overall (STATE)
- 46 Balanced
- State Minnesota
- 46 Balanced · D+2
- County
- — inherits STATE
- City
- — inherits STATE
ZIP-level market 56255
- Active inventory
- 5
- Price-to-rent
- 2.3×
Monthly cashflow live
- Estimated rent
- $855 medium interval (Pro) →
- Mortgage (P&I)
- −$126
- Tax from tax record
- −$51 /mo · $610/yr
- Insurance
- −$10
- HOA
- −$0
- Vacancy / Maint / Mgmt
- −$180
- Net cashflow
- $489
Break-even live
Sensitivity live
| Price | -10% $502 | -5% $496 | +0% $489 | +5% $482 | +10% $475 |
|---|---|---|---|---|---|
| Rent | -10% $421 | -5% $455 | +0% $489 | +5% $523 | +10% $556 |
| Rate | -1.0pp $501 | -0.5pp $495 | base $489 | +0.5pp $483 | +1.0pp $476 |
UW: 25.0% down · 7.5% · 30yr · 1.5% tax · 5.0% vac · 8.0% maint · 8.0% mgmt
Financing live
Cash to close
- Down payment
- $6,000
- Closing costs
- $720
- Reserves months
- —
- Total cash needed
- —
Loan-product check · same deal, 3 products live
Conventional
25% down · 7.5% · 30yr
- Down + closing
- —
- Monthly P&I
- —
- Monthly cashflow
- —
- DSCR
- —
- Eligible?
- —
Personal DTI + credit; lowest rate.
DSCR
20% down · 8.5% · 30yr
- Down + closing
- —
- Monthly P&I
- —
- Monthly cashflow
- —
- DSCR
- —
- Eligible?
- —
No personal income docs; deal must DSCR.
Hard money
10% down · 12.0% · 12mo
- Down + closing
- —
- Monthly P&I
- —
- Monthly cashflow
- —
- DSCR
- —
- Eligible?
- —
Short-term bridge; refi at stabilization.
Listing history 21 events
-
2026-06-16status $23,999 Pending 20 DOM
-
2026-06-15days on market $23,999 Active 20 DOM
-
2026-06-13days on market $23,999 Active 18 DOM
-
2026-06-12days on market $23,999 Active 17 DOM
-
2026-06-09days on market $23,999 Active 14 DOM
-
2026-06-08days on market $23,999 Active 13 DOM
-
2026-06-07days on market $23,999 Active 12 DOM
-
2026-06-07days on market $23,999 Active 11 DOM
-
2026-06-04days on market $23,999 Active 8 DOM
-
2026-06-02days on market $23,999 Active 7 DOM
-
2026-06-01days on market $23,999 Active 6 DOM
-
2026-05-31days on market $23,999 Active 5 DOM
-
2026-05-31days on market $23,999 Active 4 DOM
-
2026-05-26$23,999 Active
-
2025-06-10soldstatus $59,000
-
2019-02-02historical 125-char remark
Show marketing remark (125 chars)
3 bedroom 1 1/2 story home located on Main Street of Lucan. Property is being sold ''AS IS'' with possession to be immediate.
-
2011-10-06soldstatus $12,000 125-char remark
Show marketing remark (133 chars)
3 bedroom 1 1/2 story home located on Main Street of Lucan. Property is being sold "AS IS" with possession to be immediate.
-
2011-10-06soldstatus $12,000
Show marketing remark (133 chars)
3 bedroom 1 1/2 story home located on Main Street of Lucan. Property is being sold "AS IS" with possession to be immediate.
-
2011-10-06soldstatus $12,000 133-char remark
Show marketing remark (133 chars)
3 bedroom 1 1/2 story home located on Main Street of Lucan. Property is being sold "AS IS" with possession to be immediate.
-
2010-11-04$19,900 125-char remark
Show marketing remark (133 chars)
3 bedroom 1 1/2 story home located on Main Street of Lucan. Property is being sold "AS IS" with possession to be immediate.
-
2010-11-04$19,900 133-char remark
Show marketing remark (133 chars)
3 bedroom 1 1/2 story home located on Main Street of Lucan. Property is being sold "AS IS" with possession to be immediate.
ⓘ Source: listings_history table (triggers on properties + properties_extension) + one-shot
backfill from property_details.listing_events for pre-trigger history.
Tax reassessment forecast MN · Partial reset (capped growth)
- Current annual tax
- $610 · $51/mo
- Projected year-2 tax
- $610 · $51/mo
- Expected delta
- $0/yr ($0/mo · 0.0%)
ⓘ Screening estimate from a state-policy table — verify with the county assessor before closing.
Nearby sold comps map
Loading sold comps map…
Walkable amenities ~0.75 mi
Loading nearby amenities…
Taxation est. · year 1
- Rental income
- $10,262
- − Mortgage interest
- −$1,344
- − Property taxes
- −$610
- − Insurance
- −$120
- − Repairs & maintenance
- −$821
- − Management
- −$821
- − Depreciation
- −$698
- Taxable income
- $5,848
- Est. tax owed @ 24.0%
- −$1,403
- After-tax cash flow
- $4,463/yr
For passive investors: Depreciation is non-cash, so a rental often shows a tax loss while cash-flowing — sheltering income. Rental losses are passive: they offset passive income freely, and up to $25,000/yr can offset ordinary (W-2) income if you actively participate and your MAGI is under $100k (phasing out to $0 by $150k); unused losses carry forward. On sale, claimed depreciation is recaptured at up to 25%, and gains may owe capital-gains tax (a 1031 exchange can defer both). Figures are a year-1 estimate at your 24.0% rate — not tax advice; consult a CPA.
Schools (NCES district)
- District
- Wabasso Public School District
- NCES district ID
- 2741430
- Math proficiency
- 50% ▼ -11.00%
- Reading proficiency
- 48% ▼ -8.00%
- Median HH income
- $50,656
- Composite
- 42.03/100
- National rank
- #3331
- State rank
- #130 of 301 in MN
Livability — Lucan
- Score
- 62/100
- State rank
- #696
- US rank
- #16747
Category grades
Schools grade is shown separately in the Schools card above.
Census & demographics
- Census place
- Lucan, MN
- Population (ZIP)
- 407
Population outlook (Redwood County) Hauer SSP2
- Today (2025)
- 14,504 people
- By 2030
- 13,983 · -3.6%
- By 2040
- 13,056 · -10.0%
- By 2050
- 12,225 · -15.7%
- By 2075
- 11,051 · -23.8%
- By 2100
- 9,786 · -32.5%
Race, ethnicity, and origin ACS 2023
- Neighborhood character
- Predominantly White (94%)
- Race & ethnicity
- White 94% Hispanic / Latino 3% Two or more races 2%
- Common ancestry
- Romanian 9% Portuguese 4% Scandinavian 1%
- Languages at home
- 99% English-only · French/Haitian/Cajun 1%
Political lean MEDSL · Redwood
- 2024 margin
- Solid R (+43.3) · D 27.7% · R 71.0% · Other 1.2%
- 2008→2024 swing
- -29.8pp toward R · 2008: -13.6pp · 2024: -43.3pp
- All cycles
- 2024: R+43.3 2020: R+41.2 2016: R+43.0 2012: R+20.1 2008: R+13.6
Not yet ingested
- Civics
- —
Market trends
- HPI YoY
- —
- Current HPI
- —
- Rent YoY
- —
- Metro
- —
- State GDP YoY
- ▲ 2.41%
- F500 in state
- 34
Industry mix (Fortune 500 HQ in MN)
| Industry | F500 HQs | Revenue |
|---|---|---|
| Healthcare | 2 | $407B |
|
||
| Retail | 2 | $150B |
|
||
| Consumer Goods | 2 | $32B |
|
||
| Industrial Machinery | 2 | $6B |
|
||
| Agriculture | 1 | $40B |
|
||
| Healthcare / Medical Devices | 1 | $32B |
|
||
Price history
+20.6% since first listed8 events — show timeline
- 2026-05-26 Listed $23,999 NORTHSTARMLS as Distributed by MLS Grid
- 2025-06-10 Sold (Public Records) $59,000 Public Records
- 2019-02-02 Listing Removed — NORTHSTARMLS as Distributed by MLS Grid
- 2011-10-06 Sold (Public Records) $12,000 Public Records
- 2011-10-06 Sold (MLS) $12,000 NORTHSTARMLS as Distributed by MLS Grid
- 2011-10-06 Sold (MLS) $12,000 NORTHSTARMLS as Distributed by MLS Grid
- 2010-11-04 Listed $19,900 NORTHSTARMLS as Distributed by MLS Grid
- 2010-11-04 Listed $19,900 NORTHSTARMLS as Distributed by MLS Grid
Property tax history
+1.5%/yrLatest (2025): $610 · +2.0% YoY. Source: county tax records.
Cash-flow waterfall
monthlySold comps — $/sqft
last 12 mo · ≤1 miLoading sold comps…