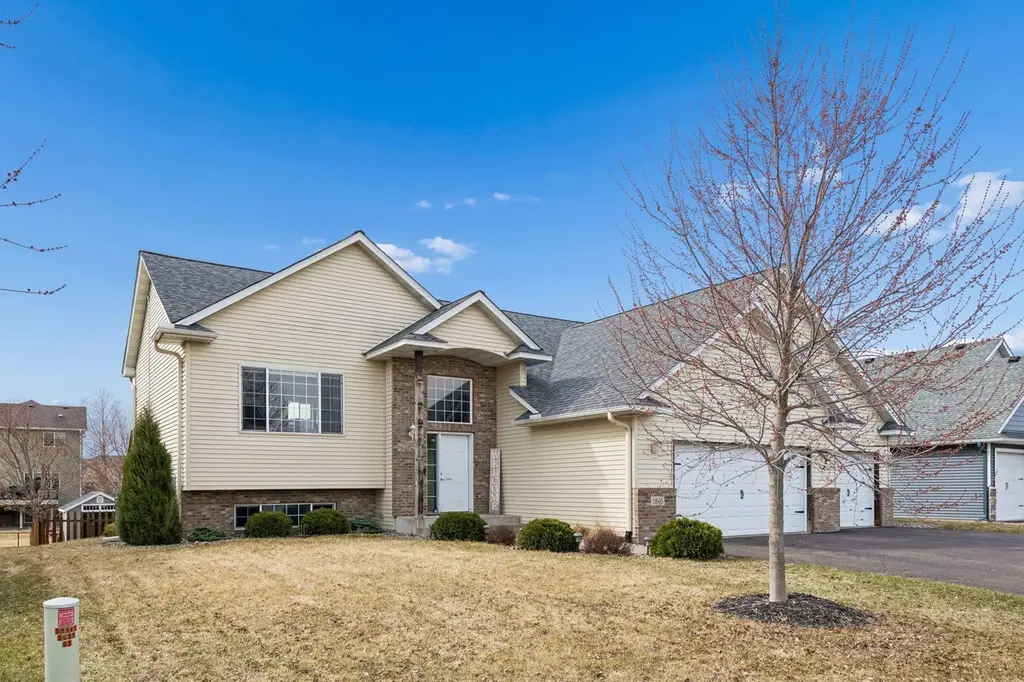
11645 11th St NE
Hanover, MN 55341
$465,000F
3 bd · 2.0 ba ·
1,396 sqft ·
Built 2006
· SingleFamily
· Pending
· 10 DOM
Cashflow @ list (25.0% down · 7.5%)
Estimated rent
$2,000/mo
Mortgage (P&I)
−$2,439
Tax + insurance
−$544
HOA
−$0
Vac / Maint / Mgmt
−$420
Net cashflow
$-1,402/mo
Annual
$-16,825/yr
Cap rate
2.67%
Cash-on-cash
-12.92%
DSCR
0.43
1% rule
0.43%
Cash to close
$130,200
Investor read
- This is a 3-bed/2.0-bath single-family listed at $465k.
- At list price, monthly cash flow is $-1k ($-17k/yr) — negative.
- To cash-flow at today's rent, offer at most $217k (53.3% below list).
- To meet the 1% rule (rent ≥ 1% of price), the offer needs to be $200k (57.0% below list).
- Only 10 days on market — expect competitive offers; lowballing is unlikely to land.
- Recommended offer: $200k (57.0% below list) — sets the bar for 1% rule.
- Local home prices are declining (-3.0%/yr); year-one equity from $3k of loan paydown is wiped out by about $14k of value loss. Plan a longer hold.
- Location reads 72/100 on livability (#293 in MN) — a middle-class / working-renter tenant base. Strengths: crime A+, employment A+, housing A+; Watch: amenities F, commute F, cost of living F.
- Buffalo-Hanover-Montrose Public Schools (town): math 52% / reading 56% proficiency, ranked #63 of 301 in MN (top 21%) — acceptable for families but not a draw, mixed tenant base, ~2y average lease; only 18% free/reduced lunch — higher-income household profile.
- Zoned schools: Hanover Elementary (math 72% / reading 67%, grade A-, #74 of 857 statewide, top 10%, 369 students, 18% FRL); Buffalo Community Middle (math 48% / reading 53%, grade C, #72 of 258 statewide, top 29%, 1,142 students, 30% FRL); Buffalo Senior High (math 42% / reading 61%, grade D+, #124 of 471 statewide, top 27%, 1,818 students, 24% FRL).
- Market conditions: 102 active listings in the ZIP; 1 comparable units currently listed for rent nearby; 1,260 units permitted in Wright County in 2024 (180 in 5+ unit buildings).
- Wright County population projected at +9% by 2050 — modest demand growth; plan on rents tracking national, not racing it.
- 3 sale attempts since 15y ago with the ask held roughly flat each time — persistent listings suggest the price (not the market) is what's stuck; bring a comps-based counter.
- Current owner paid $245k; list at $465k implies a 90% gain — meaningful room to come down on a strong offer.
- Cap rate 2.7% vs local median 4.0% in Hanover — below-typical yield; the buyer is paying a premium for something (appreciation thesis, condition, location) that the cap rate doesn't capture.
Questions for listing agent
- What do current leases actually rent for vs. the listed asking? Can we see a recent rent roll and the last 12 months of T-12 income?
- Is there a deadline driving the sale (1031 exchange, divorce, estate, relocation)? That informs how much negotiation room exists.
- Schools are A-rated — typically a magnet for longer-tenancy family renters. What's the average tenant stay here, and is there a school-zone premium baked into asking?
- The area grade is low — what's the realistic commute time and amenity access for the typical tenant pool here? Any planned neighborhood developments (good or bad) we should know about?
- What's the average days-on-market for RENTAL listings here right now (not sales)? A rising rental-DOM trend means longer vacancies and softer asking-rent achievability than the comps imply.
- What's the recent tenant-quality profile in this submarket — average credit score on applications, eviction rate, late-payment / NSF rate, and stable-employment percentage? A property-management company in the area should have these aggregated.
- How much new for-sale + rental construction is in the pipeline within 1–3 miles? Heavy new supply typically softens prices + rents 12–24 months out; constrained supply supports both.
CashFlowRE · CFR-RFKC36914A1HJ2
· Data 4 weeks ago
cashflowre.app · 2026-05-29