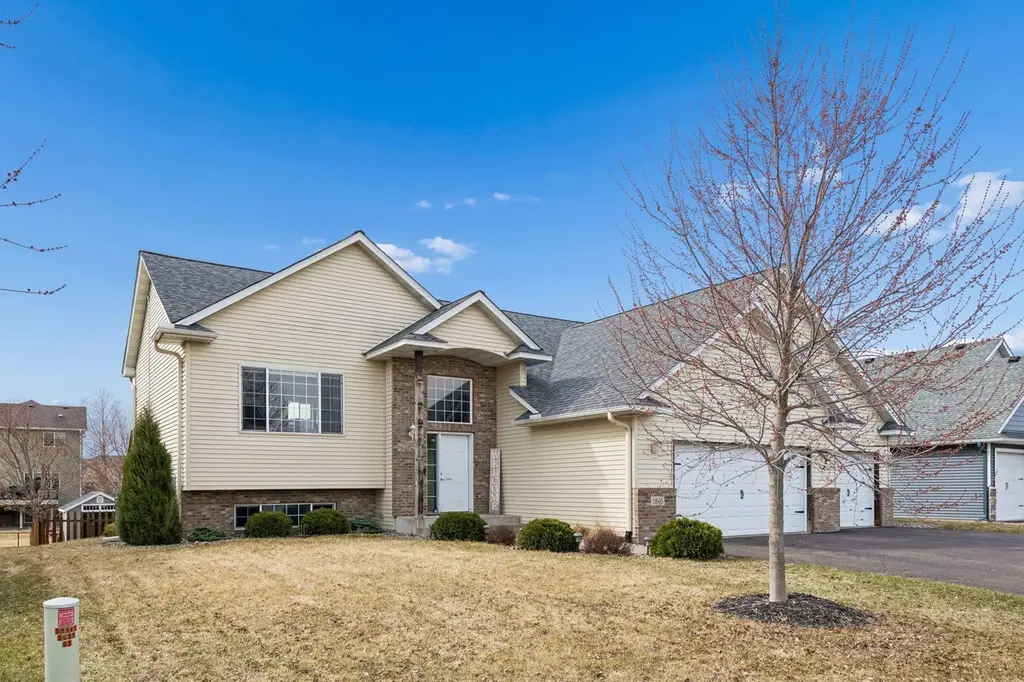
11645 11th St NE · Hanover, MN
Flood risk 1/10 · Minimal
- FEMA flood zone
- X (unshaded)
- Chance of flooding over 30 yrs
- 0.0%
- Est. flood insurance / yr
- $473 – $860
Fire risk 2/10 · Minimal
- Est. fire insurance / yr
- $888 – $1,650
Heat risk 2/10 · Minimal
- Hot days now (above 98°F)
- 7 days/yr
- Hot days in 30 yrs
- 14 days/yr
Wind risk 2/10 · Minimal
- Chance of severe wind over 30 yrs
- —
Air-quality risk 2/10 · Minimal
- Unhealthy air days now
- 1 days/yr
- Unhealthy air days in 30 yrs
- 2 days/yr
Risk factors via First Street. Map © Google.
Why this score? — see what drove the F grade
The composite is a weighted blend of 9 inputs, each scored 0–100. Each bar is that input's sub-score; the figure is the points it added to the 100-point composite (weight × sub-score).
- ARV discount +7.5/15.0
- Schools +4.8/10.0
- Livability +3.6/5.0
- Cash flow +3.5/30.0
- Rent growth +2.5/5.0
- Condition / age +2.5/5.0
- 1% rule +0.0/10.0
- DSCR +0.0/10.0
- Appreciation +0.0/10.0
$465,000
🖨 Deal sheet (PDF) 📄 Offer letter ✓ Due diligence
Listing remarks MLS
Beautiful split entry home. New kitchen appliances. Hardwood flooring in kitchen. Huge deck for lounging and grilling. 3 beds, 2 baths on main floor. Master has private bath. Basement is finished with extra bath and bedroom. Basement is great for entertaining the whole family. Plenty of storage space in mechanical room for all of your extra things. Backyard is fenced in!
Key facts
- 0.29 acre lot
- 3 garage spots
- Built 2006
Neighborhood map
What this means for you Summary
Snapshot
- This is a 3-bed/2.0-bath single-family listed at $465k.
Deal economics
- At list price, monthly cash flow is $-1k ($-17k/yr) — negative.
- To cash-flow at today's rent, offer at most $217k (53.3% below list).
- To meet the 1% rule (rent ≥ 1% of price), the offer needs to be $200k (57.0% below list).
- Recommended offer: $200k (57.0% below list) — sets the bar for 1% rule.
- Cap rate 2.7% vs local median 4.0% in Hanover — below-typical yield; the buyer is paying a premium for something (appreciation thesis, condition, location) that the cap rate doesn't capture.
Location & tenants
- Location reads 72/100 on livability (#293 in MN) — a middle-class / working-renter tenant base. Strengths: crime A+, employment A+, housing A+; Watch: amenities F, commute F, cost of living F.
- Buffalo-Hanover-Montrose Public Schools (town): math 52% / reading 56% proficiency, ranked #63 of 301 in MN (top 21%) — acceptable for families but not a draw, mixed tenant base, ~2y average lease; only 18% free/reduced lunch — higher-income household profile.
- Zoned schools: Hanover Elementary (math 72% / reading 67%, grade A-, #74 of 857 statewide, top 10%, 369 students, 18% FRL); Buffalo Community Middle (math 48% / reading 53%, grade C, #72 of 258 statewide, top 29%, 1,142 students, 30% FRL); Buffalo Senior High (math 42% / reading 61%, grade D+, #124 of 471 statewide, top 27%, 1,818 students, 24% FRL).
- Market conditions: 102 active listings in the ZIP; 1 comparable units currently listed for rent nearby; 1,260 units permitted in Wright County in 2024 (180 in 5+ unit buildings).
Forward outlook
- Local home prices are declining (-3.0%/yr); year-one equity from $3k of loan paydown is wiped out by about $14k of value loss. Plan a longer hold.
- Wright County population projected at +9% by 2050 — modest demand growth; plan on rents tracking national, not racing it.
Negotiation context
- Only 10 days on market — expect competitive offers; lowballing is unlikely to land.
- 3 sale attempts since 15y ago with the ask held roughly flat each time — persistent listings suggest the price (not the market) is what's stuck; bring a comps-based counter.
- Current owner paid $245k; list at $465k implies a 90% gain — meaningful room to come down on a strong offer.
Questions for the listing agent
- What do current leases actually rent for vs. the listed asking? Can we see a recent rent roll and the last 12 months of T-12 income?
- Is there a deadline driving the sale (1031 exchange, divorce, estate, relocation)? That informs how much negotiation room exists.
- Schools are A-rated — typically a magnet for longer-tenancy family renters. What's the average tenant stay here, and is there a school-zone premium baked into asking?
- The area grade is low — what's the realistic commute time and amenity access for the typical tenant pool here? Any planned neighborhood developments (good or bad) we should know about?
- What's the average days-on-market for RENTAL listings here right now (not sales)? A rising rental-DOM trend means longer vacancies and softer asking-rent achievability than the comps imply.
- What's the recent tenant-quality profile in this submarket — average credit score on applications, eviction rate, late-payment / NSF rate, and stable-employment percentage? A property-management company in the area should have these aggregated.
- How much new for-sale + rental construction is in the pipeline within 1–3 miles? Heavy new supply typically softens prices + rents 12–24 months out; constrained supply supports both.
Investment metrics
- 1% rule
- 0.43% ✗
- Cap rate
- 2.67%
- Cash-on-cash
- -12.92%
- DSCR
- 0.43
- GRM
- 19.4
CMA / ARV
No comps found within radius.
Projected returns pro-forma
-3.0% appreciation · 3.0% rent growth · sell at horizon
- IRR
- -40.5%
- Equity multiple
- -0.27×
- Total profit
- $-164,762
- Equity at exit
- $69,333
- IRR
- -65.9%
- Equity multiple
- -0.99×
- Total profit
- $-258,915
- Equity at exit
- $40,205
Cash invested: $130,200 (down + closing). Projections, not guarantees.
Landlord ↔ Tenant lean methodology
- Overall (STATE)
- 46 Balanced
- State Minnesota
- 46 Balanced · D+2
- County
- — inherits STATE
- City
- — inherits STATE
ZIP-level market 55341
- Home prices YoY
- -16.0%
- Active inventory
- 102
- Price-to-rent
- 19.4×
Monthly cashflow live
- Estimated rent
- $2,000 medium interval (Pro) →
- Mortgage (P&I)
- −$2,439
- Tax from tax record
- −$350 /mo · $4,198/yr
- Insurance
- −$194
- HOA
- −$0
- Vacancy / Maint / Mgmt
- −$420
- Net cashflow
- $-1,402
Break-even live
Sensitivity live
| Price | -10% $-1,139 | -5% $-1,270 | +0% $-1,402 | +5% $-1,534 | +10% $-1,665 |
|---|---|---|---|---|---|
| Rent | -10% $-1,560 | -5% $-1,481 | +0% $-1,402 | +5% $-1,323 | +10% $-1,244 |
| Rate | -1.0pp $-1,168 | -0.5pp $-1,284 | base $-1,402 | +0.5pp $-1,523 | +1.0pp $-1,645 |
UW: 25.0% down · 7.5% · 30yr · 1.5% tax · 5.0% vac · 8.0% maint · 8.0% mgmt
Financing live
Cash to close
- Down payment
- $116,250
- Closing costs
- $13,950
- Reserves months
- —
- Total cash needed
- —
Loan-product check · same deal, 3 products live
Conventional
25% down · 7.5% · 30yr
- Down + closing
- —
- Monthly P&I
- —
- Monthly cashflow
- —
- DSCR
- —
- Eligible?
- —
Personal DTI + credit; lowest rate.
DSCR
20% down · 8.5% · 30yr
- Down + closing
- —
- Monthly P&I
- —
- Monthly cashflow
- —
- DSCR
- —
- Eligible?
- —
No personal income docs; deal must DSCR.
Hard money
10% down · 12.0% · 12mo
- Down + closing
- —
- Monthly P&I
- —
- Monthly cashflow
- —
- DSCR
- —
- Eligible?
- —
Short-term bridge; refi at stabilization.
Rent comps 1 comps
| Address | Beds | Baths | Sqft | Rent | $/sqft | DOM | Units | Dist |
|---|---|---|---|---|---|---|---|---|
| 11321 16th St NE Saint Michael, MN | 3.0 | 3.0 | 1505 | $2,000 | $1.33 | 0d | 1 | 0.50mi |
Listing history 14 events
-
2026-04-27status Pending
-
2026-04-19historical Contingent - Inspection
-
2026-04-17$465,000 Active
-
2026-04-14historical $465,000
-
2016-12-27soldstatus $245,000
-
2016-12-09soldstatus $245,000 Sold 374-char remark
Show marketing remark (374 chars)
Beautiful split entry home. New kitchen appliances. Hardwood flooring in kitchen. Huge deck for lounging and grilling. 3 beds, 2 baths on main floor. Master has private bath. Basement is finished with extra bath and bedroom. Basement is great for entertaining the whole family. Plenty of storage space in mechanical room for all of your extra things. Backyard is fenced in!
-
2016-11-03status Pending 374-char remark
Show marketing remark (374 chars)
Beautiful split entry home. New kitchen appliances. Hardwood flooring in kitchen. Huge deck for lounging and grilling. 3 beds, 2 baths on main floor. Master has private bath. Basement is finished with extra bath and bedroom. Basement is great for entertaining the whole family. Plenty of storage space in mechanical room for all of your extra things. Backyard is fenced in!
-
2016-10-24historical Contingent - Inspection 374-char remark
Show marketing remark (374 chars)
Beautiful split entry home. New kitchen appliances. Hardwood flooring in kitchen. Huge deck for lounging and grilling. 3 beds, 2 baths on main floor. Master has private bath. Basement is finished with extra bath and bedroom. Basement is great for entertaining the whole family. Plenty of storage space in mechanical room for all of your extra things. Backyard is fenced in!
-
2016-10-18price $244,900 374-char remark
Show marketing remark (374 chars)
Beautiful split entry home. New kitchen appliances. Hardwood flooring in kitchen. Huge deck for lounging and grilling. 3 beds, 2 baths on main floor. Master has private bath. Basement is finished with extra bath and bedroom. Basement is great for entertaining the whole family. Plenty of storage space in mechanical room for all of your extra things. Backyard is fenced in!
-
2016-09-28$249,900 Active 374-char remark
Show marketing remark (374 chars)
Beautiful split entry home. New kitchen appliances. Hardwood flooring in kitchen. Huge deck for lounging and grilling. 3 beds, 2 baths on main floor. Master has private bath. Basement is finished with extra bath and bedroom. Basement is great for entertaining the whole family. Plenty of storage space in mechanical room for all of your extra things. Backyard is fenced in!
-
2011-09-09soldstatus $155,000 174-char remark
Show marketing remark (174 chars)
Solid newer built home in great neighborhood. New carpet and paint throughout. Open and bright floor plan, across the street from play ground. Unfinished walkout Lower level.
-
2011-08-21historical 174-char remark
Show marketing remark (174 chars)
Solid newer built home in great neighborhood. New carpet and paint throughout. Open and bright floor plan, across the street from play ground. Unfinished walkout Lower level.
-
2011-08-02$159,900 174-char remark
Show marketing remark (174 chars)
Solid newer built home in great neighborhood. New carpet and paint throughout. Open and bright floor plan, across the street from play ground. Unfinished walkout Lower level.
-
2006-10-18soldstatus $277,900
ⓘ Source: listings_history table (triggers on properties + properties_extension) + one-shot
backfill from property_details.listing_events for pre-trigger history.
Tax reassessment forecast MN · Partial reset (capped growth)
- Current annual tax
- $4,198 · $350/mo
- Projected year-2 tax
- $4,703 · $392/mo
- Expected delta
- +$505/yr (+$42/mo · 12.0%)
ⓘ Screening estimate from a state-policy table — verify with the county assessor before closing.
Climate risk First Street
- Flood 1/10 Low FEMA zone X (unshaded) · 0% chance over 30 yrs
- Wildfire 2/10 Low
- Heat 2/10 Low 7 d/yr ≥98°F today · 14 d/yr by 30 yrs out
- Wind 2/10 Low
- Air quality 2/10 Low 1 unhealthy d/yr today · 2 by 30 yrs out
Nearby sold comps map
Loading sold comps map…
Walkable amenities ~0.75 mi
Loading nearby amenities…
Taxation est. · year 1
- Rental income
- $24,000
- − Mortgage interest
- −$26,047
- − Property taxes
- −$4,198
- − Insurance
- −$2,325
- − Repairs & maintenance
- −$1,920
- − Management
- −$1,920
- − Depreciation
- −$13,527
- Taxable loss
- −$25,938
- Est. tax savings @ 24.0%
- +$6,225
- After-tax cash flow
- $-10,600/yr
For passive investors: Depreciation is non-cash, so a rental often shows a tax loss while cash-flowing — sheltering income. Rental losses are passive: they offset passive income freely, and up to $25,000/yr can offset ordinary (W-2) income if you actively participate and your MAGI is under $100k (phasing out to $0 by $150k); unused losses carry forward. On sale, claimed depreciation is recaptured at up to 25%, and gains may owe capital-gains tax (a 1031 exchange can defer both). Figures are a year-1 estimate at your 24.0% rate — not tax advice; consult a CPA.
Schools (NCES district)
- District
- Buffalo-Hanover-Montrose Public Schools
- NCES district ID
- 2707200
- Math proficiency
- 52% ▼ -13.00%
- Reading proficiency
- 56% ▼ -9.00%
- Median HH income
- $72,549
- Composite
- 48.25/100
- National rank
- #2159
- State rank
- #63 of 301 in MN
Livability — Hanover
- Score
- 72/100
- State rank
- #293
- US rank
- #6387
Category grades
Schools grade is shown separately in the Schools card above.
Census & demographics
- Census place
- Hanover, MN
- City population
- 3,454
- Population (ZIP)
- 3,454
Population outlook (Wright County) Hauer SSP2
- Today (2025)
- 142,526 people
- By 2030
- 146,915 · +3.1%
- By 2040
- 153,625 · +7.8%
- By 2050
- 155,416 · +9.0%
- By 2075
- 150,352 · +5.5%
- By 2100
- 130,631 · -8.3%
Race, ethnicity, and origin ACS 2023
- Neighborhood character
- Predominantly White (91%)
- Race & ethnicity
- White 91% Two or more races 5% Asian 3% Native American 1%
- Common ancestry
- Portuguese 12% Romanian 5% Iranian 3%
- Foreign-born
- 2% · South Korea, Canada
- Languages at home
- 98% English-only · Other Asian/Pacific 2% German/W. Germanic 1%
Political lean MEDSL · Wright
- 2024 margin
- Strong R (+29.4) · D 34.4% · R 63.8% · Other 1.8%
- 2008→2024 swing
- -11.9pp toward R · 2008: -17.4pp · 2024: -29.4pp
- All cycles
- 2024: R+29.4 2020: R+28.6 2016: R+33.2 2012: R+21.4 2008: R+17.4
Not yet ingested
- Civics
- —
Market trends
- HPI YoY
- ▼ -44.77%
- Current HPI
- 234.7046
- Rent YoY
- —
- Metro
- —
- State GDP YoY
- ▲ 2.41%
- F500 in state
- 34
Industry mix (Fortune 500 HQ in MN)
| Industry | F500 HQs | Revenue |
|---|---|---|
| Healthcare | 2 | $407B |
|
||
| Retail | 2 | $150B |
|
||
| Consumer Goods | 2 | $32B |
|
||
| Industrial Machinery | 2 | $6B |
|
||
| Agriculture | 1 | $40B |
|
||
| Healthcare / Medical Devices | 1 | $32B |
|
||
Price history
+67.3% since first listed14 events — show timeline
- 2026-04-27 Pending — NORTHSTARMLS as Distributed by MLS Grid
- 2026-04-19 Contingent — NORTHSTARMLS as Distributed by MLS Grid
- 2026-04-17 Listed $465,000 NORTHSTARMLS as Distributed by MLS Grid
- 2026-04-14 Coming Soon $465,000 NORTHSTARMLS as Distributed by MLS Grid
- 2016-12-27 Sold (Public Records) $245,000 Public Records
- 2016-12-09 Sold (MLS) $245,000 NORTHSTARMLS as Distributed by MLS Grid
- 2016-11-03 Pending — NORTHSTARMLS as Distributed by MLS Grid
- 2016-10-24 Contingent — NORTHSTARMLS as Distributed by MLS Grid
- 2016-10-18 Price Changed $244,900 NORTHSTARMLS as Distributed by MLS Grid
- 2016-09-28 Listed $249,900 NORTHSTARMLS as Distributed by MLS Grid
- 2011-09-09 Sold (MLS) $155,000 NORTHSTARMLS as Distributed by MLS Grid
- 2011-08-21 Listing Removed — NORTHSTARMLS as Distributed by MLS Grid
- 2011-08-02 Listed $159,900 NORTHSTARMLS as Distributed by MLS Grid
- 2006-10-18 Sold (Public Records) $277,900 Public Records
Property tax history
+5.2%/yrLatest (2025): $4,198 · -3.4% YoY. Source: county tax records.
Cash-flow waterfall
monthlySold comps — $/sqft
last 12 mo · ≤1 miLoading sold comps…