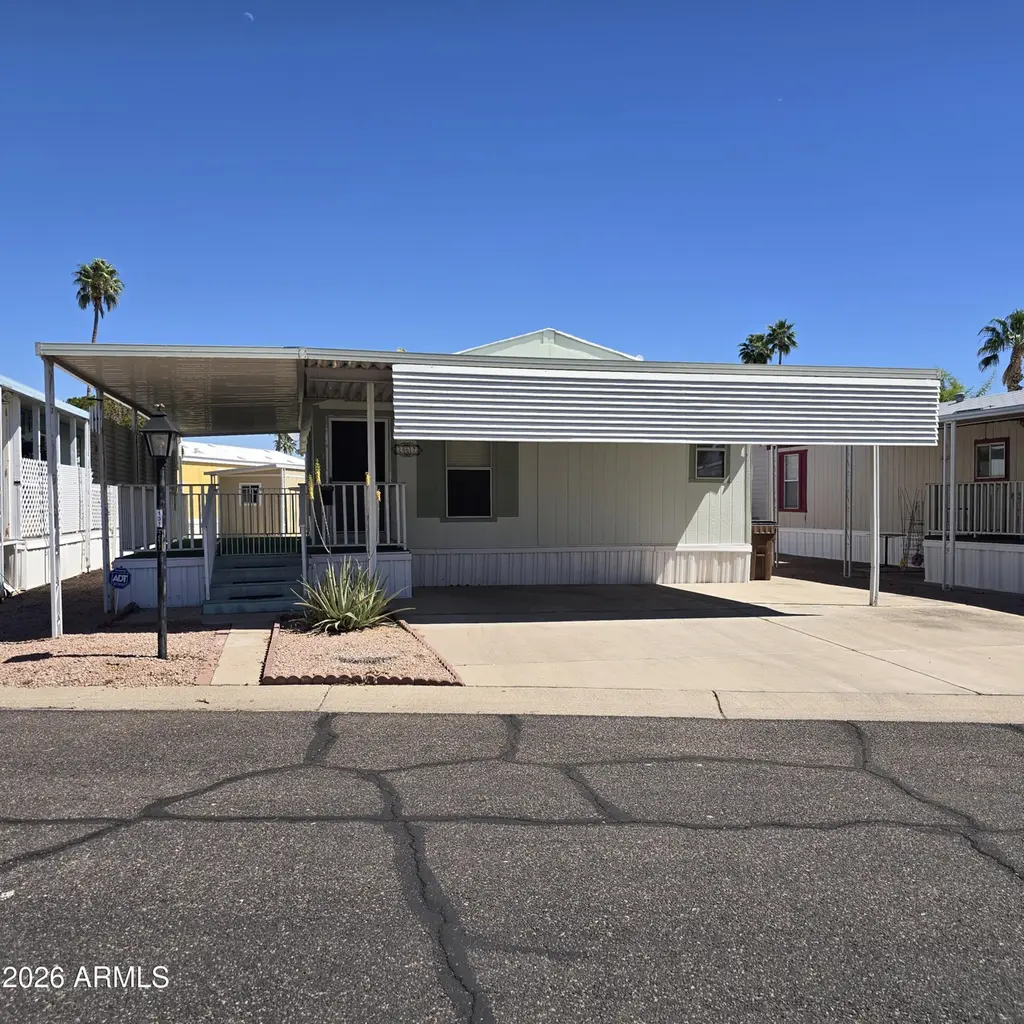
205 W Bell Rd #131
Phoenix, AZ 85023
$68,900B
2 bd · 2.0 ba ·
1,056 sqft ·
Built 1997
· Manufactured
· Active
· 89 DOM
Cashflow @ list (25.0% down · 7.5%)
Estimated rent
$1,581/mo
Mortgage (P&I)
−$361
Tax + insurance
−$115
HOA
−$0
Vac / Maint / Mgmt
−$332
Net cashflow
$773/mo
Annual
$9,271/yr
Cap rate
19.75%
Cash-on-cash
48.06%
DSCR
3.14
1% rule
2.29%
Cash to close
$19,292
Investor read
- This is a 2-bed/2.0-bath manufactured listed at $69k. Condition is rated good.
- At list price, monthly cash flow is $773 ($9k/yr) — positive.
- The deal already cash-flows at list — no discount required.
- Meets the 1% rule at list price ($2k rent vs $69k).
- It's been on market 89 days — a 6% lower offer ($65k) is reasonable based on typical stale-listing flexibility.
- Recommended offer: $65k (6.0% below list) — sets the bar for market timing.
- Local home prices are declining (-3.0%/yr); year-one equity from $476 of loan paydown is wiped out by about $2k of value loss. Plan a longer hold.
- Location reads 75/100 on livability (#16 in AZ, #3,924 nationally) — a middle-class / working-renter tenant base. Strengths: amenities A+, commute A+, housing A+; Watch: health & safety C-, crime F.
- Glendale Union High School District (4285) (urban): math 23% / reading 31% proficiency, ranked #130 of 249 in AZ (top 52%) — low school quality limits family demand, transient renter base, plan for 1-2y turnover.
- Zoned schools: Lookout Mountain School (math 48% / reading 62%, grade C, #202 of 1,109 statewide, top 19%, 881 students, 24% FRL); Mountain Sky Middle School (math 30% / reading 28%, grade F, #90 of 218 statewide, top 42%, 713 students, 55% FRL); Thunderbird High School (math 28% / reading 35%, grade F, #109 of 381 statewide, top 29%, 1,540 students, 43% FRL).
- Market conditions: Rents falling (-3.4%/yr); 142 active listings in the ZIP; 40 comparable units currently listed for rent nearby; rentals leasing fast (median 7d on market — plan ~1-2 weeks tenant-placement turnaround); solid renter incomes; 36,011 units permitted in Maricopa County in 2024 (12,801 in 5+ unit buildings).
- Maricopa County population projected at +38% by 2050 — long-run rental-demand tailwind backs the buy-and-hold thesis.
- At projected returns (-3.0% appreciation + 0.0% rent growth), your $19k cash investment doubles in ~3 years — after that, you're playing with house money.
- Climate carrying-cost: extreme-heat days projected 5→13/yr by 2055 (HVAC capex compounding) — expect insurance premiums to compound above CPI over the hold.
- Cap rate 19.7% vs local median 3.3% in Phoenix — top-decile yield for the area; either an underpriced asset or a hidden risk that comps aren't pricing in. Stress-test before assuming the spread holds.
Questions for listing agent
- It's been on market 89 days. Have you received any prior offers? Is the seller open to a 6% concession, seller financing, or rate buy-down credit?
- Why hasn't it sold? Are there any deal-killer items the seller is aware of (foundation, flood, title, zoning, code violations)?
- Is there a deadline driving the sale (1031 exchange, divorce, estate, relocation)? That informs how much negotiation room exists.
- Crime grade is F in this area — have there been break-ins, vandalism, or insurance claims at this property in the last 3 years? What carrier currently insures it and at what premium?
- What's the average days-on-market for RENTAL listings here right now (not sales)? A rising rental-DOM trend means longer vacancies and softer asking-rent achievability than the comps imply.
- What's the recent tenant-quality profile in this submarket — average credit score on applications, eviction rate, late-payment / NSF rate, and stable-employment percentage? A property-management company in the area should have these aggregated.
- How much new for-sale + rental construction is in the pipeline within 1–3 miles? Heavy new supply typically softens prices + rents 12–24 months out; constrained supply supports both.
CashFlowRE · CFR-RGC10KAPGSK3YZ
· Data 1 day ago
cashflowre.app · 2026-05-29