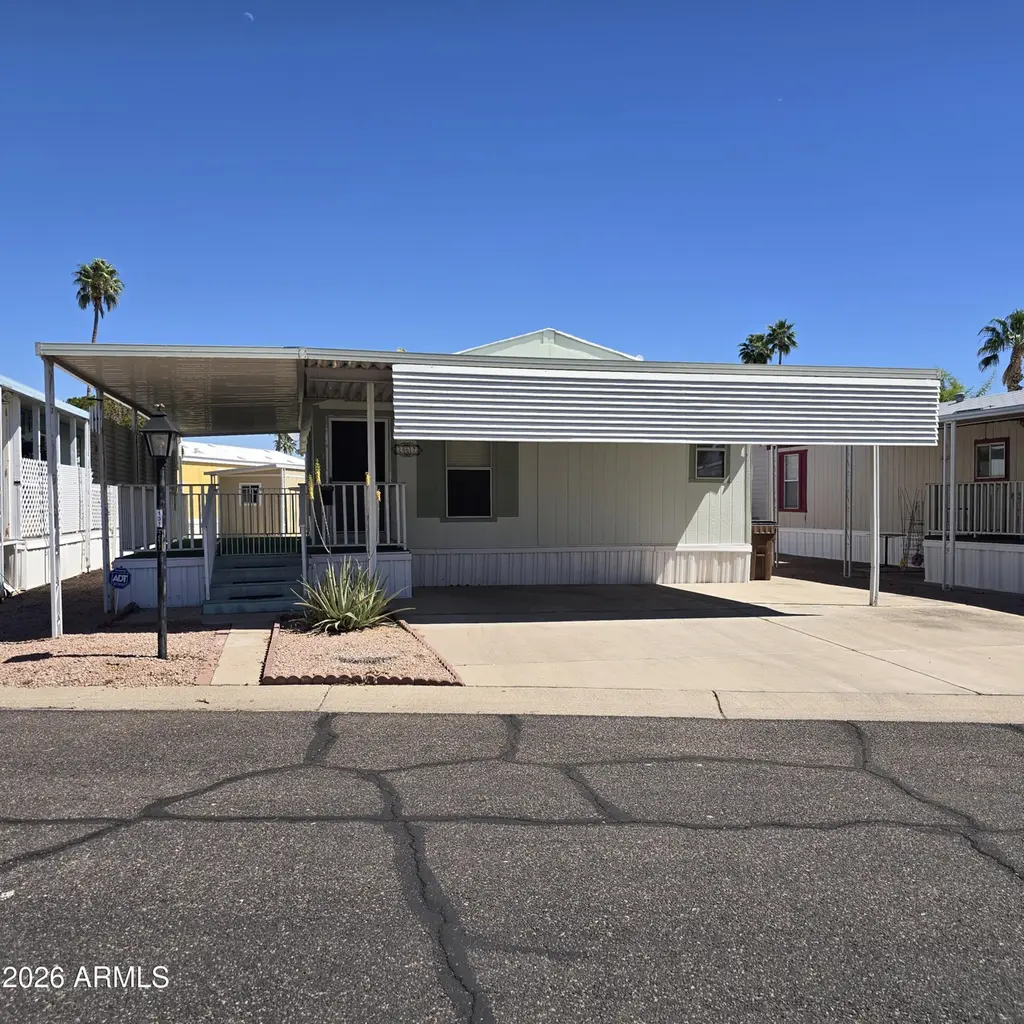
205 W Bell Rd #131 · Phoenix, AZ
Flood risk 1/10 · Minimal
- FEMA flood zone
- X (unshaded)
- Chance of flooding over 30 yrs
- 0.0%
- Est. flood insurance / yr
- $507 – $1,088
Fire risk 1/10 · Minimal
- Est. fire insurance / yr
- $610 – $1,132
Heat risk 8/10 · Major
- Hot days now (above 110°F)
- 5 days/yr
- Hot days in 30 yrs
- 13 days/yr
Wind risk 1/10 · Minimal
- Chance of severe wind over 30 yrs
- —
Air-quality risk 3/10 · Minor
- Unhealthy air days now
- 3 days/yr
- Unhealthy air days in 30 yrs
- 4 days/yr
Risk factors via First Street. Map © Google.
Why this score? — see what drove the B grade
The composite is a weighted blend of 9 inputs, each scored 0–100. Each bar is that input's sub-score; the figure is the points it added to the 100-point composite (weight × sub-score).
- Cash flow +30.0/30.0
- ARV discount +12.3/15.0
- 1% rule +10.0/10.0
- DSCR +10.0/10.0
- Livability +3.8/5.0
- Condition / age +3.8/5.0
- Schools +2.3/10.0
- Rent growth +1.7/5.0
- Appreciation +0.0/10.0
$68,900
🖨 Deal sheet 📄 Offer letter ✓ Due diligence
Listing remarks
ON LEASED LAND: Enter into this spacious 2 bedroom 2 bath open floor plan. , 1997 Cavco. Front room open concept to kitchen and formal dining room. All appliances convey. Kitchen has a breakfast bar as well. Both bedrooms are spacious. Enjoy the outdoors on your open front porch. Plenty of room to add a fence. Front carport enough for 2 vehicles. Located in Central Park village, a 55 plus resort golf community. Community has 9 hole golf, heated pool and spa, billiards and more.
Key facts
- Open floor plan
- Billiards
- Open front porch
Tags
Property features AI
Finance
- Other: Building area source: assessor
- Financial info: Land lease amount: monthly fee
- HOA & community: Land lease (monthly); Monthly land lease payment; Association maintains grounds and streets; Community amenities: pool, golf, heated community spa, community media room, coin-op laundry, biking/walking path, fitness center
Exterior
- Parking: 2 covered parking spaces; 2 carport spaces
- Utilities: City water; Public sewer
- Home design: Manufactured/mobile home; Leasehold ownership
- Construction: Board & batten siding; Wood frame construction; Other roof type
- Exterior features: Shed(s); Storage; No fencing; Gravel/stone front and back; Cul-de-sac lot; Private maintained road; Asphalt road access
Interior
- Kitchen: Laminate counters; Refrigerator; Dishwasher; Garbage disposal
- Bedrooms: 2 possible bedrooms
- Flooring: Laminate flooring
- Bathrooms: 2 full bathrooms
- Heating & cooling: Electric heating; Central air; Ceiling fans
- Interior features: High-speed internet; Breakfast bar; No interior steps (single-level); Primary bedroom with full bathroom; Dual-pane windows; Storage
- Laundry & utility: Indoor laundry
Neighborhood map
What this means for you Summary
Snapshot
- This is a 2-bed/2.0-bath manufactured listed at $69k. Condition is rated good.
Deal economics
- At list price, monthly cash flow is $773 ($9k/yr) — positive.
- The deal already cash-flows at list — no discount required.
- Meets the 1% rule at list price ($2k rent vs $69k).
- Recommended offer: $65k (6.0% below list) — sets the bar for market timing.
- Cap rate 19.8% vs local median 3.3% in Phoenix — top-decile yield for the area; either an underpriced asset or a hidden risk that comps aren't pricing in. Stress-test before assuming the spread holds.
Location & tenants
- Location reads 75/100 on livability (#16 in AZ, #3,924 nationally) — a middle-class / working-renter tenant base. Strengths: amenities A+, commute A+, housing A+; Watch: health & safety C-, crime F.
- Glendale Union High School District (4285) (urban): math 23% / reading 31% proficiency, ranked #130 of 249 in AZ (top 52%) — low school quality limits family demand, transient renter base, plan for 1-2y turnover.
- Market conditions: Rents falling (-3.4%/yr); 138 active listings in the ZIP; 40 comparable units currently listed for rent nearby; rentals leasing fast (median 8d on market — plan ~1-2 weeks tenant-placement turnaround); solid renter incomes; 36,011 units permitted in Maricopa County in 2024 (12,801 in 5+ unit buildings).
Forward outlook
- Local home prices are declining (-3.0%/yr); year-one equity from $476 of loan paydown is wiped out by about $2k of value loss. Plan a longer hold.
- Maricopa County population projected at +38% by 2050 — long-run rental-demand tailwind backs the buy-and-hold thesis.
- At projected returns (-3.0% appreciation + 0.0% rent growth), your $19k cash investment doubles in ~3 years — after that, you're playing with house money.
Negotiation context
- It's been on market 86 days — a 6% lower offer ($65k) is reasonable based on typical stale-listing flexibility.
Risks & watch-outs
- Climate carrying-cost: extreme-heat days projected 5→13/yr by 2055 (HVAC capex compounding) — expect insurance premiums to compound above CPI over the hold.
Questions for the listing agent
- It's been on market 86 days. Have you received any prior offers? Is the seller open to a 6% concession, seller financing, or rate buy-down credit?
- Why hasn't it sold? Are there any deal-killer items the seller is aware of (foundation, flood, title, zoning, code violations)?
- Is there a deadline driving the sale (1031 exchange, divorce, estate, relocation)? That informs how much negotiation room exists.
- Crime grade is F in this area — have there been break-ins, vandalism, or insurance claims at this property in the last 3 years? What carrier currently insures it and at what premium?
- What's the average days-on-market for RENTAL listings here right now (not sales)? A rising rental-DOM trend means longer vacancies and softer asking-rent achievability than the comps imply.
- What's the recent tenant-quality profile in this submarket — average credit score on applications, eviction rate, late-payment / NSF rate, and stable-employment percentage? A property-management company in the area should have these aggregated.
- How much new for-sale + rental construction is in the pipeline within 1–3 miles? Heavy new supply typically softens prices + rents 12–24 months out; constrained supply supports both.
Investment metrics
- 1% rule
- 2.29% ✓
- Cap rate
- 19.76%
- Cash-on-cash
- 48.08%
- DSCR
- 3.14
- GRM
- 3.6
CMA / ARV
- ARV (on-the-fly)
- $77,088
- Comps found
- 6
Show comp detail 6 sales within ~0.75 mi
| Address | Dist | Beds/Ba | Sqft | Sold | Price | $/sf | Match |
|---|---|---|---|---|---|---|---|
| 16821 N 2nd Dr #282 | 0.06mi | 2/2.0 | 1,056 (0%) | 15mo | $73,500 | $70 | 85 |
| 205 W Bell Rd #293 | 0.00mi | 2/2.0 | 1,200 (+14%) | 1mo | $35,000 | $29 | 76 |
| 16622 N 2nd Dr #182 | 0.11mi | 2/2.0 | 960 (-9%) | 7mo | $70,000 | $73 | 74 |
| 16618 N 1st Dr #114 | 0.12mi | 2/2.0 | 1,152 (+9%) | 23mo | $45,000 | $39 | 60 |
| 17833 N 1st Pl | 0.67mi | 2/2.0 | 992 (-6%) | 3mo | $280,000 | $282 | 56 |
| 17821 N 1st St | 0.63mi | 3/2.0 (+1) | 1,169 (+11%) | 16mo | $250,000 | $214 | 34 |
Match score weights: distance 35% · size 25% · config 20% · recency 20%. Top-matched comps best support the ARV.
Projected returns pro-forma
-3.0% appreciation · 0.0% rent growth · sell at horizon
- IRR
- 42.1%
- Equity multiple
- 2.73×
- Total profit
- $33,455
- Equity at exit
- $10,273
- IRR
- 46.9%
- Equity multiple
- 4.87×
- Total profit
- $74,712
- Equity at exit
- $5,957
Cash invested: $19,292 (down + closing). Projections, not guarantees.
Landlord ↔ Tenant lean methodology
- Overall (STATE)
- 87 Strongly Landlord-Friendly
- State Arizona
- 87 Strongly Landlord-Friendly · R+3
- County
- — inherits STATE
- City
- — inherits STATE
ZIP-level market 85023
- Rents YoY
- -3.4%
- Active inventory
- 138
- Price-to-rent
- 3.6×
Monthly cashflow live
- Estimated rent
- $1,581 high interval (Pro) →
- Mortgage (P&I)
- −$361
- Tax est. 1.5%
- −$86 /mo · $1,034/yr
- Insurance
- −$29
- HOA
- −$0
- Vacancy / Maint / Mgmt
- −$332
- Net cashflow
- $773
Break-even live
UW: 25.0% down · 7.5% · 30yr · 1.5% tax · 5.0% vac · 8.0% maint · 8.0% mgmt
Financing live
Cash to close
- Down payment
- $17,225
- Closing costs
- $2,067
- Reserves months
- —
- Total cash needed
- —
Loan-product check · same deal, 3 products live
Conventional
25% down · 7.5% · 30yr
- Down + closing
- —
- Monthly P&I
- —
- Monthly cashflow
- —
- DSCR
- —
- Eligible?
- —
Personal DTI + credit; lowest rate.
DSCR
20% down · 8.5% · 30yr
- Down + closing
- —
- Monthly P&I
- —
- Monthly cashflow
- —
- DSCR
- —
- Eligible?
- —
No personal income docs; deal must DSCR.
Hard money
10% down · 12.0% · 12mo
- Down + closing
- —
- Monthly P&I
- —
- Monthly cashflow
- —
- DSCR
- —
- Eligible?
- —
Short-term bridge; refi at stabilization.
Rent comps 40 comps
| Address | Beds | Baths | Sqft | Rent | $/sqft | DOM | Units | Dist |
|---|---|---|---|---|---|---|---|---|
| 110 W Bell Rd Unit 2 Phoenix, AZ | 2.0 | 2.0 | 980 | $1,649 | $1.68 | 24d | 1 | 0.15mi |
| 110 W Bell Rd Unit 12 Phoenix, AZ | 1.0 | 1.0 | 856 | $1,399 | $1.63 | 24d | 1 | 0.15mi |
| 110 W Bell Rd Unit 1 Phoenix, AZ | 1.0 | 1.0 | 739 | $1,299 | $1.76 | 24d | 1 | 0.15mi |
| 11 E Bell Rd Phoenix, AZ | 1.0–2.0 | 1.0–2.0 | 950 | $1,705 | $1.79 | 1d | 11 | 0.15mi |
| 16609 N 1st Ave Phoenix, AZ | 2.0 | 1.0 | 910 | $1,350 | $1.48 | 1d | 1 | 0.15mi |
| 110 W Bell Rd Phoenix, AZ | 1.0 | 1.0 | 845 | $1,499 | $1.77 | 7d | 1 | 0.17mi |
| 220 W Bell Rd Phoenix, AZ | 1.0–3.0 | 1.0–2.0 | 1082 | $1,564 | $1.45 | 1d | 32 | 0.18mi |
| 10 E Bell Rd Phoenix, AZ | 2.0 | 1.0–2.0 | 658 | $1,419 | $2.16 | 1d | 33 | 0.24mi |
| 110 E Greenway Pkwy Phoenix, AZ | 1.0–2.0 | 1.0–2.0 | 866 | $1,455 | $1.68 | 1d | 8 | 0.26mi |
| 118 E Anderson Ave Phoenix, AZ | 2.0 | 2.0 | 1272 | $1,950 | $1.53 | 24d | 1 | 0.34mi |
| 17420 N 2nd Ave Phoenix, AZ | 3.0 | 2.0 | 1312 | $2,000 | $1.52 | 21d | 1 | 0.40mi |
| 229 E Anderson Ave Phoenix, AZ | 2.0 | 2.0 | 1256 | $2,100 | $1.67 | 7d | 1 | 0.43mi |
| 314 E Hartford Ave Phoenix, AZ | 2.0 | 2.0 | 1320 | $2,195 | $1.66 | 24d | 1 | 0.47mi |
| 16220 N 7th St Phoenix, AZ | 1.0–2.0 | 1.0–2.0 | 885 | $1,708 | $1.93 | 1d | 35 | 0.52mi |
| 17031 N 11th Ave Phoenix, AZ | 2.0 | 1.0–2.0 | 771 | $1,437 | $1.86 | 1d | 25 | 0.60mi |
| 17646 N 6th Ave Phoenix, AZ | 3.0 | 2.0 | 1286 | $2,200 | $1.71 | 3d | 1 | 0.66mi |
| 17249 N 7th St Phoenix, AZ | 1.0–3.0 | 1.0–2.0 | 956 | $1,518 | $1.59 | 1d | 37 | 0.78mi |
| 1118 W Helena Dr Phoenix, AZ | 2.0 | 1.0 | 960 | $2,200 | $2.29 | 43d | 1 | 0.82mi |
| 17625 N 7th St Phoenix, AZ | 1.0–3.0 | 1.0–2.0 | 925 | $1,369 | $1.48 | 3d | 7 | 0.87mi |
| 18217 N 2nd Pl Phoenix, AZ | 2.0 | 1.0 | 833 | $1,300 | $1.56 | 16d | 1 | 0.91mi |
| 815 E Grovers Ave Phoenix, AZ | 1.0–2.0 | 1.0–2.5 | 1469 | $2,800 | $1.91 | 5d | 2 | 0.99mi |
| 726 E Villa Rita Dr Phoenix, AZ | 2.0 | 2.0 | 1088 | $2,000 | $1.84 | 10d | 1 | 1.07mi |
| 726 E Villa Rita Dr Phoenix, AZ | 2.0 | 2.0 | 1088 | $2,000 | $1.84 | 18d | 1 | 1.07mi |
| 1100 E Bell Rd Phoenix, AZ | 1.0–3.0 | 1.0–2.0 | 987 | $1,822 | $1.85 | 1d | 26 | 1.07mi |
| 17228 N 16th Dr #4 Phoenix, AZ | 2.0 | 2.0 | 980 | $1,500 | $1.53 | 20d | 1 | 1.09mi |
| 17617 N 9th St Phoenix, AZ | 1.0–3.0 | 1.0–2.0 | 956 | $1,513 | $1.58 | 1d | 35 | 1.11mi |
| 17017 N 12th St Phoenix, AZ | 1.0–2.0 | 1.0 | 910 | $2,500 | $2.75 | 24d | 2 | 1.13mi |
| 1305 W Villa Maria Dr Phoenix, AZ | 3.0 | 2.0 | 1401 | $2,300 | $1.64 | 18d | 1 | 1.18mi |
| 16875 N 12th St Unit 17 Phoenix, AZ | 3.0 | 2.5 | 1323 | $2,200 | $1.66 | 24d | 1 | 1.22mi |
| 16601 N 12th St Phoenix, AZ | 1.0–3.0 | 1.0–2.0 | 1242 | $1,697 | $1.37 | 1d | 21 | 1.23mi |
| 1130 E Grovers Ave Phoenix, AZ | 2.0 | 2.0 | 934 | $1,336 | $1.43 | 2d | 12 | 1.25mi |
| 17239 N 19th Ave Phoenix, AZ | 1.0–2.0 | 1.0–2.0 | 801 | $1,221 | $1.52 | 1d | 32 | 1.26mi |
| 17617 N 17th Ln Phoenix, AZ | 3.0 | 2.0 | 1353 | $2,100 | $1.55 | 3d | 1 | 1.27mi |
| 1633 W Charleston Ave Phoenix, AZ | 3.0 | 1.5 | 1441 | $1,796 | $1.25 | 7d | 1 | 1.29mi |
| 17425 N 19th Ave Phoenix, AZ | 1.0–2.0 | 1.0–2.0 | 776 | $1,327 | $1.71 | 1d | 40 | 1.30mi |
| 1126 E Charleston Ave Phoenix, AZ | 3.0 | 2.0 | 1214 | $2,450 | $2.02 | 3d | 1 | 1.33mi |
| 1032 E Villa Maria Dr Phoenix, AZ | 2.0 | 2.0 | 1097 | $1,850 | $1.69 | 7d | 1 | 1.34mi |
| 1032 E Villa Maria Dr Phoenix, AZ | 2.0 | 2.0 | 1097 | $1,850 | $1.69 | 20d | 1 | 1.34mi |
| 18437 N 8th Pl Phoenix, AZ | 3.0 | 2.0 | 1355 | $1,980 | $1.46 | 5d | 1 | 1.36mi |
| 1136 E Villa Rita Dr Phoenix, AZ | 2.0 | 2.0 | 1141 | $1,950 | $1.71 | 24d | 1 | 1.36mi |
Listing history 14 events
-
2026-06-18days on market $68,900 Active 86 DOM
-
2026-06-17days on market $68,900 Active 85 DOM
-
2026-06-16days on market $68,900 Active 84 DOM
-
2026-06-15days on market $68,900 Active 83 DOM
-
2026-06-13days on market $68,900 Active 81 DOM
-
2026-06-09days on market $68,900 Active 77 DOM
-
2026-06-08days on market $68,900 Active 76 DOM
-
2026-06-07days on market $68,900 Active 75 DOM
-
2026-06-04days on market $68,900 Active 72 DOM
-
2026-06-03days on market $68,900 Active 71 DOM
-
2026-06-02days on market $68,900 Active 70 DOM
-
2026-06-01days on market $68,900 Active 69 DOM
-
2026-05-31days on market $68,900 Active 68 DOM
-
2026-03-24$68,900 Active
ⓘ Source: listings_history table (triggers on properties + properties_extension) + one-shot
backfill from property_details.listing_events for pre-trigger history.
Climate risk First Street
- Flood 1/10 Low FEMA zone X (unshaded) · 0% chance over 30 yrs
- Wildfire 1/10 Low
- Heat 8/10 Severe 5 d/yr ≥110°F today · 13 d/yr by 30 yrs out
- Wind 1/10 Low
- Air quality 3/10 Moderate 3 unhealthy d/yr today · 4 by 30 yrs out
Nearby sold comps map
Loading sold comps map…
Walkable amenities ~0.75 mi
Loading nearby amenities…
Taxation est. · year 1
- Rental income
- $18,974
- − Mortgage interest
- −$3,859
- − Property taxes
- −$1,034
- − Insurance
- −$344
- − Repairs & maintenance
- −$1,518
- − Management
- −$1,518
- − Depreciation
- −$2,004
- Taxable income
- $8,696
- Est. tax owed @ 24.0%
- −$2,087
- After-tax cash flow
- $7,188/yr
For passive investors: Depreciation is non-cash, so a rental often shows a tax loss while cash-flowing — sheltering income. Rental losses are passive: they offset passive income freely, and up to $25,000/yr can offset ordinary (W-2) income if you actively participate and your MAGI is under $100k (phasing out to $0 by $150k); unused losses carry forward. On sale, claimed depreciation is recaptured at up to 25%, and gains may owe capital-gains tax (a 1031 exchange can defer both). Figures are a year-1 estimate at your 24.0% rate — not tax advice; consult a CPA.
Condition & rehab AI · 14 photos
This manufactured home is in good condition with a good condition score of 75. It is move-in ready with minor cosmetic updates that would significantly increase its resale and rental value.
Value-add opportunities
- Both Paint exterior — Enhances curb appeal and resale value.
- Both Landscaping — Improves curb appeal and rental value.
- Both Replace ceiling fans — Aesthetically pleasing and energy-efficient.
Renovation cost estimate screening
Value-add ROI direction
- Both Paint exterior — Enhances curb appeal and resale value. ↑
- Both Landscaping — Improves curb appeal and rental value. ↑
- Both Replace ceiling fans — Aesthetically pleasing and energy-efficient. ↑
ⓘ Cost ranges are severity-bucket heuristics (US national rule-of-thumb). Get contractor quotes + a written scope before underwriting a rehab budget.
Schools (NCES district)
- District
- Glendale Union High School District (4285)
- NCES district ID
- 0403450
- Math proficiency
- 23% ▼ -38.00%
- Reading proficiency
- 31% ▼ -19.00%
- Median HH income
- $40,846
- Composite
- 22.81/100
- National rank
- #8020
- State rank
- #130 of 249 in AZ
Livability — Phoenix
- Score
- 75/100
- State rank
- #16
- US rank
- #3924
Category grades
Schools grade is shown separately in the Schools card above.
Census & demographics
- Census place
- Phoenix, AZ
- County
- Maricopa County · 4,537,380 people
- City population
- 1,500,198
- Metro
- Phoenix-Mesa-Chandler, AZ
- Population (ZIP)
- 35,034
- Household income
- $77,369
- Rent vs Own
- Severe rent burden
- 1539.0
Population outlook (Maricopa County) Hauer SSP2
- Today (2025)
- 4,979,203 people
- By 2030
- 5,378,229 · +8.0%
- By 2040
- 6,156,598 · +23.6%
- By 2050
- 6,872,376 · +38.0%
- By 2075
- 8,401,270 · +68.7%
- By 2100
- 9,247,439 · +85.7%
Race, ethnicity, and origin ACS 2023
- Neighborhood character
- Diverse neighborhood (Simpson 0.61)
- Race & ethnicity
- White 56% Hispanic / Latino 26% Two or more races 11% Black 7% Asian 6% Native American 2%
- Hispanic origin (detail)
- Mexican 22%
- Common ancestry
- Romanian 3% Italian 3% Portuguese 2%
- Foreign-born
- 17% · Canada, Jamaica, Vietnam
- Languages at home
- 73% English-only · Spanish 18% Other Indo-European 3% Other Asian/Pacific 2%
Political lean MEDSL · Maricopa
- 2024 margin
- Toss-up / Even · D 47.7% · R 51.2% · Other 1.1%
- 2008→2024 swing
- +7.1pp toward D · 2008: -10.6pp · 2024: -3.5pp
- All cycles
- 2024: R+3.5 2020: D+2.2 2016: R+3.5 2012: R+12.0 2008: R+10.6
Not yet ingested
- Civics
- —
Market trends
- HPI YoY
- ▼ -348.79%
- Current HPI
- 311.8587
- Rent YoY
- ▼ -3.35%
- Metro
- Phoenix-Mesa-Chandler, AZ
- State GDP YoY
- ▲ 4.54%
- F500 in state
- 20
Industry mix (Fortune 500 HQ in AZ)
| Industry | F500 HQs | Revenue |
|---|---|---|
| Technology | 2 | $13B |
|
||
| Mining / Metals | 1 | $23B |
|
||
| Environmental Services | 1 | $16B |
|
||
| Metals / Steel | 1 | $14B |
|
||
| Technology Distribution | 1 | $9B |
|
||
| Homebuilding | 1 | $8B |
|
||
Price history
1 event — show timeline
- 2026-03-24 Listed $68,900 ARMLS
Cash-flow waterfall
monthlySold comps — $/sqft
last 12 mo · ≤1 miLoading sold comps…