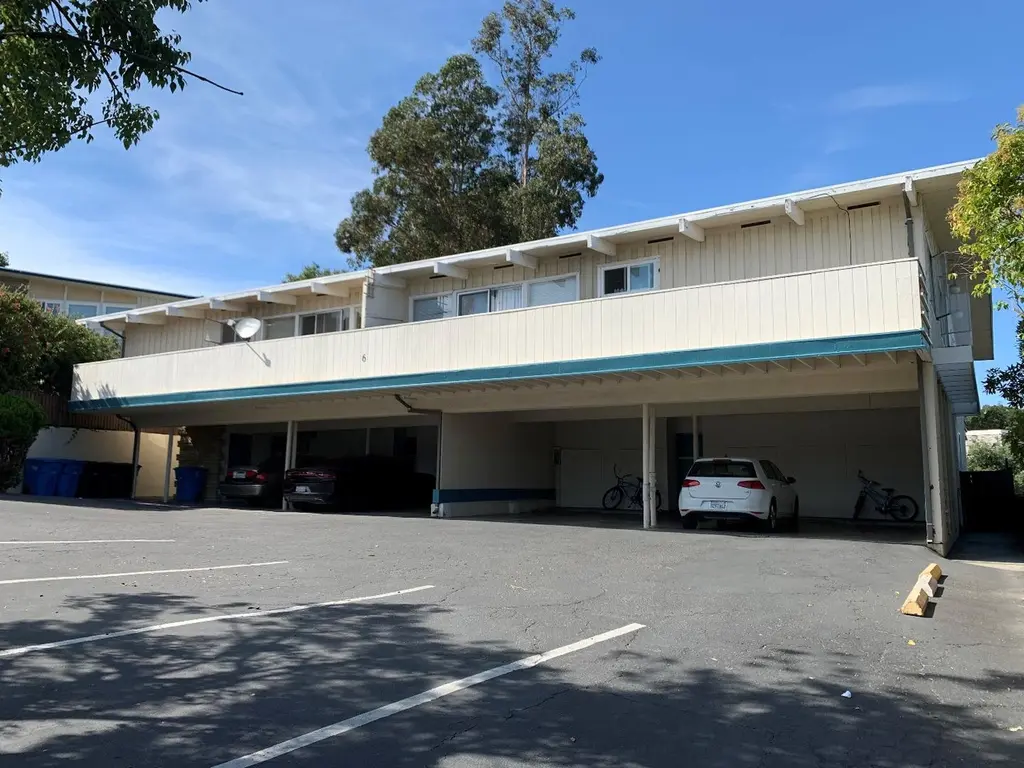
6 Garden Ct
Belmont, CA 94002
$3,250,000C-
10 bd · 8.0 ba ·
7,282 sqft ·
Built 1960
· MultiFamily
· Active
· 72 DOM
Cashflow @ list (25.0% down · 7.5%)
Estimated rent
$24,497/mo
Mortgage (P&I)
−$17,043
Tax + insurance
−$2,701
HOA
−$0
Vac / Maint / Mgmt
−$5,144
Net cashflow
$-391/mo
Annual
$-4,695/yr
Cap rate
6.15%
Cash-on-cash
-0.52%
DSCR
0.98
1% rule
0.75%
Cash to close
$910,000
Investor read
- This is a 10-bed/8.0-bath multifamily listed at $3.25M.
- At list price, monthly cash flow is $-391 ($-5k/yr) — negative.
- To cash-flow at today's rent, offer at most $3.18M (2.1% below list).
- To meet the 1% rule (rent ≥ 1% of price), the offer needs to be $2.45M (24.6% below list).
- It's been on market 72 days — a 6% lower offer ($3.06M) is reasonable based on typical stale-listing flexibility.
- Recommended offer: $2.45M (24.6% below list) — sets the bar for 1% rule.
- In year one you build about $225k of equity ($22k loan paydown + $202k appreciation (6.2% local appreciation)).
- Location reads 82/100 on livability (#28 in CA, #1,062 nationally) — a professional / high-income tenant draw. Strengths: schools A+, commute A+, employment A+; Watch: cost of living F.
- Belmont-Redwood Shores Elementary (suburban): math 75% / reading 80% proficiency, ranked #25 of 517 in CA (top 5%) — strong family-tenant draw, lease renewals of 3-5y typical; only 6% free/reduced lunch — higher-income household profile.
- Market conditions: Rents rising fast (+4.6%/yr); 66 active listings in the ZIP; high-income renter base; 1,019 units permitted in San Mateo County in 2024 (484 in 5+ unit buildings).
- San Mateo County population projected at +24% by 2050 — long-run rental-demand tailwind backs the buy-and-hold thesis.
- 2 sale attempts; this cycle's ask has dropped $700k (18%) from the opening price — seller is motivated, your offer sets the floor, not the list.
- Current owner paid $120k; list at $3.25M implies a 2620% gain — meaningful room to come down on a strong offer.
- By year 2, paydown + projected appreciation supports a ~$360k cash-out refi (75% LTV) — recoverable capital for the next deal without selling this one.
- Cap rate 6.1% vs local median 0.7% in Belmont — top-decile yield for the area; either an underpriced asset or a hidden risk that comps aren't pricing in. Stress-test before assuming the spread holds.
- At $24,497/mo this rent would consume 144% of the median local household income ($204k/yr) (locally 939% of renters already pay >50% of income on rent) — very limited rent-growth headroom before tenants either downsize or default.
Questions for listing agent
- What do current leases actually rent for vs. the listed asking? Can we see a recent rent roll and the last 12 months of T-12 income?
- It's been on market 72 days. Have you received any prior offers? Is the seller open to a 25% concession, seller financing, or rate buy-down credit?
- Built in 1960 — when were the roof, HVAC, electrical panel, plumbing, and water heater last replaced?
- Why hasn't it sold? Are there any deal-killer items the seller is aware of (foundation, flood, title, zoning, code violations)?
- Is there a deadline driving the sale (1031 exchange, divorce, estate, relocation)? That informs how much negotiation room exists.
- Schools are A-rated — typically a magnet for longer-tenancy family renters. What's the average tenant stay here, and is there a school-zone premium baked into asking?
- What's the average days-on-market for RENTAL listings here right now (not sales)? A rising rental-DOM trend means longer vacancies and softer asking-rent achievability than the comps imply.
- What's the recent tenant-quality profile in this submarket — average credit score on applications, eviction rate, late-payment / NSF rate, and stable-employment percentage? A property-management company in the area should have these aggregated.
CashFlowRE · CFR-RGSQFM2P6MZWV4
· Data 2 days ago
cashflowre.app · 2026-05-29