 Multi-family
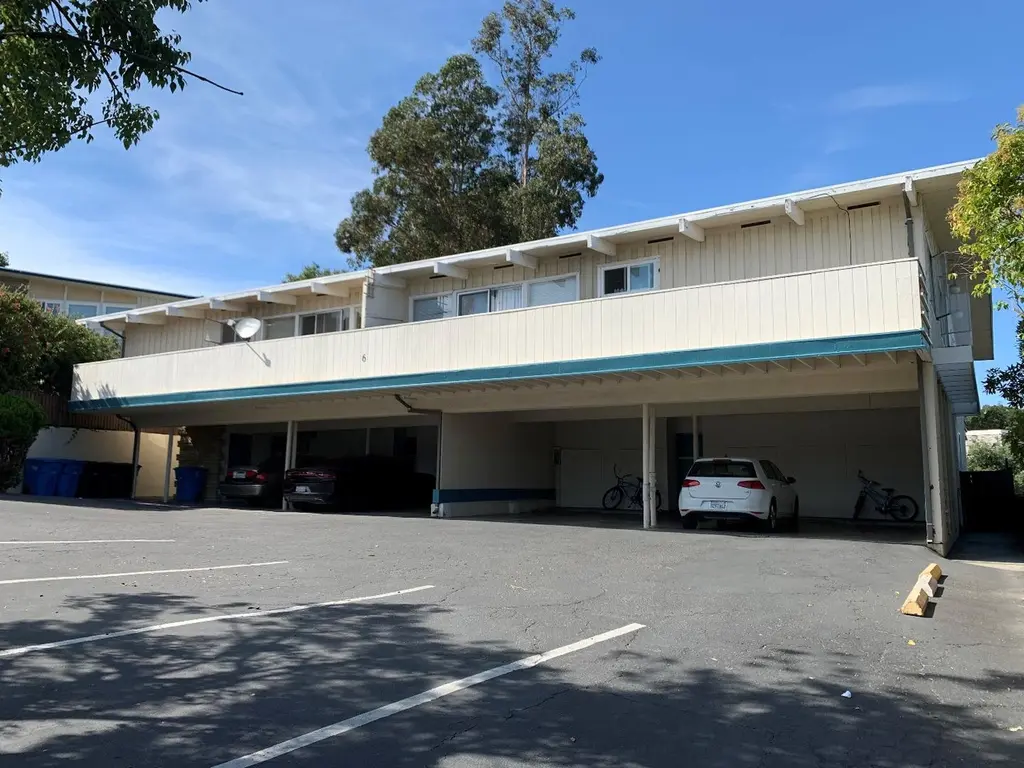
6 Garden Ct · Belmont, CA
Flood risk 1/10 · Minimal
- FEMA flood zone
- X (unshaded)
- Chance of flooding over 30 yrs
- 0.0%
- Est. flood insurance / yr
- $507 – $1,088
Fire risk 3/10 · Minor
- Est. fire insurance / yr
- $659 – $1,223
Heat risk 2/10 · Minimal
- Hot days now (above 92°F)
- 7 days/yr
- Hot days in 30 yrs
- 15 days/yr
Wind risk 1/10 · Minimal
- Chance of severe wind over 30 yrs
- —
Air-quality risk 7/10 · Major
- Unhealthy air days now
- 12 days/yr
- Unhealthy air days in 30 yrs
- 12 days/yr
Risk factors via First Street. Map © Google.
Why this score? — see what drove the C- grade
The composite is a weighted blend of 9 inputs, each scored 0–100. Each bar is that input's sub-score; the figure is the points it added to the 100-point composite (weight × sub-score).
- Cash flow +12.6/30.0
- Appreciation +8.1/10.0
- ARV discount +7.5/15.0
- Schools +7.2/10.0
- Livability +4.1/5.0
- DSCR +3.8/10.0
- Rent growth +3.6/5.0
- 1% rule +2.5/10.0
- Condition / age +2.5/5.0
$3,250,000
🖨 Deal sheet 📄 Offer letter ✓ Due diligence
Multi-family units
County records classify this as Multi-Family (5+ Unit). Listing-text estimate: 1 unit. estimate disagrees with records
5+ unit building — per-unit beds/baths from public records are typically unavailable; the breakdown below (if shown) is an estimate from the listing text.
Listing remarks MLS
"A" Location in Belmont just steps away from the Library and Carlmont High School. 2 Story apartment building with 8 Units; six 1 bed/ 1 bath and two 2 bed/1 bath. Nice and quiet cul-de-sac near the intersection of Alameda De Las Pulgas and Ralston Avenue. Close to highway 280 and 101. Situated in the mountains of Belmont. Close to Hillsborough and Burlingame. Not far from downtown San Mateo shopping district. Most tenants are long-term and huge upside for additional rents. 3 apartments have large backyards and 5 with balconies. 8 carports. Walking distance to Carlmont Shopping Center. All units are occupied Please do not disturb tenants.
Key facts
- 0.28 acre lot
- 4 parking spots
- Built 1960
Property features AI
Finance
- Other: Living area about 7,282; Property allows pets
- Financial info: Complex has at least 8 units; Annual rental income reported at $233,700; Annual gross income reported at $233,700; Gross scheduled income reported at $233,700; Gross rent multiplier 16.67; Total expenses reported at $72,514; Other expenses reported at $4,425; Tenant pays rent and electric utilities; Trash expense reported at $6,938; Utility expenses reported at $3,266; Landscape expense reported at $2,400; Individual unit rents vary (examples provided)
Exterior
- Parking: Carport parking; On-street parking; Parking area; At least 4 parking spaces; Carport capacity listed as 8 (minimum)
- Utilities: Public water; Public sewer; Public utilities; Primary electric and primary water meters; Separate electric and separate gas meters
- Home design: Apartment zoning; Single building on site
- Construction: Wood frame construction; Other foundation
- Exterior features: Backyard; Balcony or patio; Courtyard; Tar and gravel roof; Parking available
Interior
- Bedrooms: Multiple 1-bedroom units; Some 2-bedroom units
- Flooring: Carpet; Hardwood; Laminate
- Bathrooms: Multiple full bathrooms (1 per unit listed)
- Heating & cooling: Heating: Other (see remarks); Cooling: Other (see remarks)
- Interior features: Coin-operated laundry available; Carpet, hardwood, and laminate flooring
- Laundry & utility: Coin-operated laundry; Separate meters for electric and gas in some units
Neighborhood map
What this means for you Summary
Snapshot
- This is a 10-bed/8.0-bath multifamily listed at $3.25M.
Deal economics
- At list price, monthly cash flow is $-391 ($-5k/yr) — negative.
- To cash-flow at today's rent, offer at most $3.18M (2.1% below list).
- To meet the 1% rule (rent ≥ 1% of price), the offer needs to be $2.45M (24.6% below list).
- Recommended offer: $2.45M (24.6% below list) — sets the bar for 1% rule.
- Cap rate 6.1% vs local median 0.7% in Belmont — top-decile yield for the area; either an underpriced asset or a hidden risk that comps aren't pricing in. Stress-test before assuming the spread holds.
Location & tenants
- Location reads 82/100 on livability (#28 in CA, #1,062 nationally) — a professional / high-income tenant draw. Strengths: schools A+, commute A+, employment A+; Watch: cost of living F.
- Belmont-Redwood Shores Elementary (suburban): math 75% / reading 80% proficiency, ranked #25 of 517 in CA (top 5%) — strong family-tenant draw, lease renewals of 3-5y typical; only 6% free/reduced lunch — higher-income household profile.
- Market conditions: Rents rising fast (+4.6%/yr); 66 active listings in the ZIP; high-income renter base; 1,019 units permitted in San Mateo County in 2024 (484 in 5+ unit buildings).
- At $24,497/mo this rent would consume 144% of the median local household income ($204k/yr) (locally 939% of renters already pay >50% of income on rent) — very limited rent-growth headroom before tenants either downsize or default.
Forward outlook
- In year one you build about $225k of equity ($22k loan paydown + $202k appreciation (6.2% local appreciation)).
- San Mateo County population projected at +24% by 2050 — long-run rental-demand tailwind backs the buy-and-hold thesis.
- By year 2, paydown + projected appreciation supports a ~$360k cash-out refi (75% LTV) — recoverable capital for the next deal without selling this one.
Negotiation context
- It's been on market 72 days — a 6% lower offer ($3.06M) is reasonable based on typical stale-listing flexibility.
- 2 sale attempts; this cycle's ask has dropped $700k (18%) from the opening price — seller is motivated, your offer sets the floor, not the list.
- Current owner paid $120k; list at $3.25M implies a 2620% gain — meaningful room to come down on a strong offer.
Questions for the listing agent
- What do current leases actually rent for vs. the listed asking? Can we see a recent rent roll and the last 12 months of T-12 income?
- It's been on market 72 days. Have you received any prior offers? Is the seller open to a 25% concession, seller financing, or rate buy-down credit?
- Built in 1960 — when were the roof, HVAC, electrical panel, plumbing, and water heater last replaced?
- Why hasn't it sold? Are there any deal-killer items the seller is aware of (foundation, flood, title, zoning, code violations)?
- Is there a deadline driving the sale (1031 exchange, divorce, estate, relocation)? That informs how much negotiation room exists.
- Schools are A-rated — typically a magnet for longer-tenancy family renters. What's the average tenant stay here, and is there a school-zone premium baked into asking?
- What's the average days-on-market for RENTAL listings here right now (not sales)? A rising rental-DOM trend means longer vacancies and softer asking-rent achievability than the comps imply.
- What's the recent tenant-quality profile in this submarket — average credit score on applications, eviction rate, late-payment / NSF rate, and stable-employment percentage? A property-management company in the area should have these aggregated.
- How much new apartment / multifamily construction is in the pipeline within 1–3 miles? Heavy new supply (>2% of stock underway) typically softens rents 12–24 months out; light construction supports rent growth.
Investment metrics
- 1% rule
- 0.75% ✗
- Cap rate
- 6.15%
- Cash-on-cash
- -0.52%
- DSCR
- 0.98
- GRM
- 11.1
CMA / ARV
No comps found within radius.
Projected returns pro-forma
6.23% appreciation · 4.56% rent growth · sell at horizon
- IRR
- 16.0%
- Equity multiple
- 2.09×
- Total profit
- $995,230
- Equity at exit
- $2,089,951
- IRR
- 16.4%
- Equity multiple
- 4.32×
- Total profit
- $3,017,764
- Equity at exit
- $3,831,148
Cash invested: $910,000 (down + closing). Projections, not guarantees.
Landlord ↔ Tenant lean methodology
- Overall (STATE)
- 18 Strongly Tenant-Friendly
- State California
- 18 Strongly Tenant-Friendly · D+13
- County
- — inherits STATE
- City
- — inherits STATE
ZIP-level market 94002
- Home prices YoY
- 1.7%
- Rents YoY
- 4.6%
- Active inventory
- 66
- Price-to-rent
- 89.6×
Monthly cashflow live
- Estimated rent
- $24,497 high interval (Pro) →
- Mortgage (P&I)
- −$17,043
- Tax from tax record
- −$1,346 /mo · $16,157/yr
- Insurance
- −$1,354
- HOA
- −$0
- Vacancy / Maint / Mgmt
- −$5,144
- Net cashflow
- $-391
Break-even live
8-unit breakdown (identical units grouped — click to expand)
| Units | Beds | Baths | Est. rent |
|---|---|---|---|
| 6× units | 1 | 1 | $18,138 |
| #1 | 1 | 1 | $3,023 |
| #2 | 1 | 1 | $3,023 |
| #3 | 1 | 1 | $3,023 |
| #4 | 1 | 1 | $3,023 |
| #5 | 1 | 1 | $3,023 |
| #6 | 1 | 1 | $3,023 |
| 2× units | 2 | 1 | $6,356 |
| #7 | 2 | 1 | $3,178 |
| #8 | 2 | 1 | $3,178 |
| Total (8 units) | $24,497 | ||
UW: 25.0% down · 7.5% · 30yr · 1.5% tax · 5.0% vac · 8.0% maint · 8.0% mgmt
Financing live
Cash to close
- Down payment
- $812,500
- Closing costs
- $97,500
- Reserves months
- —
- Total cash needed
- —
Loan-product check · same deal, 3 products live
Conventional
25% down · 7.5% · 30yr
- Down + closing
- —
- Monthly P&I
- —
- Monthly cashflow
- —
- DSCR
- —
- Eligible?
- —
Personal DTI + credit; lowest rate.
DSCR
20% down · 8.5% · 30yr
- Down + closing
- —
- Monthly P&I
- —
- Monthly cashflow
- —
- DSCR
- —
- Eligible?
- —
No personal income docs; deal must DSCR.
Hard money
10% down · 12.0% · 12mo
- Down + closing
- —
- Monthly P&I
- —
- Monthly cashflow
- —
- DSCR
- —
- Eligible?
- —
Short-term bridge; refi at stabilization.
Listing history 24 events
-
2026-06-18days on market $3,250,000 Active 72 DOM
-
2026-06-17remarks 664-char remark
-
2026-06-17pricedays on market $3,250,000 Active 71 DOM
-
2026-06-16days on market $3,500,000 Active 70 DOM
-
2026-06-15days on market $3,500,000 Active 69 DOM
-
2026-06-13days on market $3,500,000 Active 67 DOM
-
2026-06-13days on market $3,500,000 Active 66 DOM
-
2026-06-09days on market $3,500,000 Active 63 DOM
-
2026-06-08days on market $3,500,000 Active 62 DOM
-
2026-06-07days on market $3,500,000 Active 61 DOM
-
2026-06-04days on market $3,500,000 Active 58 DOM
-
2026-06-03days on market $3,500,000 Active 57 DOM
-
2026-06-02days on market $3,500,000 Active 56 DOM
-
2026-06-01days on market $3,500,000 Active 55 DOM
-
2026-05-31days on market $3,500,000 Active 54 DOM
-
2026-05-01price $3,750,000 656-char remark
Show marketing remark (656 chars)
"A" Location in Belmont just steps away from the Library and Carlmont High School. 2 Story apartment building with 8 Units; six 1 bed/ 1 bath and two 2 bed/1 bath. Nice and quiet cul-de-sac near the intersection of Alameda De Las Pulgas and Ralston Avenue. Close to highway 280 and 101. Situated in the mountains of Belmont. Close to Hillsborough and Burlingame. Not far from downtown San Mateo shopping district. Most tenants are long-term and huge upside for additional rents. 3 apartments have large backyards and 5 with balconies. 8 carports. Walking distance to Carlmont Shopping Center. All units are occupied Please do not disturb tenants.
-
2026-04-19price $3,895,000 656-char remark
Show marketing remark (656 chars)
"A" Location in Belmont just steps away from the Library and Carlmont High School. 2 Story apartment building with 8 Units; six 1 bed/ 1 bath and two 2 bed/1 bath. Nice and quiet cul-de-sac near the intersection of Alameda De Las Pulgas and Ralston Avenue. Close to highway 280 and 101. Situated in the mountains of Belmont. Close to Hillsborough and Burlingame. Not far from downtown San Mateo shopping district. Most tenants are long-term and huge upside for additional rents. 3 apartments have large backyards and 5 with balconies. 8 carports. Walking distance to Carlmont Shopping Center. All units are occupied Please do not disturb tenants.
-
2026-04-08historical
-
2026-04-08historical
-
2026-04-07$3,950,000 Active 656-char remark
Show marketing remark (656 chars)
"A" Location in Belmont just steps away from the Library and Carlmont High School. 2 Story apartment building with 8 Units; six 1 bed/ 1 bath and two 2 bed/1 bath. Nice and quiet cul-de-sac near the intersection of Alameda De Las Pulgas and Ralston Avenue. Close to highway 280 and 101. Situated in the mountains of Belmont. Close to Hillsborough and Burlingame. Not far from downtown San Mateo shopping district. Most tenants are long-term and huge upside for additional rents. 3 apartments have large backyards and 5 with balconies. 8 carports. Walking distance to Carlmont Shopping Center. All units are occupied Please do not disturb tenants.
-
1971-03-05soldstatus $119,500
ⓘ Source: listings_history table (triggers on properties + properties_extension) + one-shot
backfill from property_details.listing_events for pre-trigger history.
Tax reassessment forecast CA · Resets to sale price
- Current annual tax
- $16,157 · $1,346/mo
- Projected year-2 tax
- $24,700 · $2,058/mo
- Expected delta
- +$8,543/yr (+$712/mo · 52.9%)
ⓘ Screening estimate from a state-policy table — verify with the county assessor before closing.
Climate risk First Street
- Flood 1/10 Low FEMA zone X (unshaded) · 0% chance over 30 yrs
- Wildfire 3/10 Moderate
- Heat 2/10 Low 7 d/yr ≥92°F today · 15 d/yr by 30 yrs out
- Wind 1/10 Low
- Air quality 7/10 Severe 12 unhealthy d/yr today · 12 by 30 yrs out
Nearby sold comps map
Loading sold comps map…
Walkable amenities ~0.75 mi
Loading nearby amenities…
Taxation est. · year 1
- Rental income
- $293,964
- − Mortgage interest
- −$182,051
- − Property taxes
- −$16,157
- − Insurance
- −$16,250
- − Repairs & maintenance
- −$23,517
- − Management
- −$23,517
- − Depreciation
- −$94,545
- Taxable loss
- −$62,073
- Est. tax savings @ 24.0%
- +$14,897
- After-tax cash flow
- $10,202/yr
For passive investors: Depreciation is non-cash, so a rental often shows a tax loss while cash-flowing — sheltering income. Rental losses are passive: they offset passive income freely, and up to $25,000/yr can offset ordinary (W-2) income if you actively participate and your MAGI is under $100k (phasing out to $0 by $150k); unused losses carry forward. On sale, claimed depreciation is recaptured at up to 25%, and gains may owe capital-gains tax (a 1031 exchange can defer both). Figures are a year-1 estimate at your 24.0% rate — not tax advice; consult a CPA.
Schools (NCES district)
- District
- Belmont-Redwood Shores Elementary
- NCES district ID
- 0604530
- Math proficiency
- 75% ▼ -4.00%
- Reading proficiency
- 80% ▼ -2.00%
- Median HH income
- $116,616
- Composite
- 71.94/100
- National rank
- #212
- State rank
- #25 of 517 in CA
Livability — Belmont
- Score
- 82/100
- State rank
- #28
- US rank
- #1062
Category grades
Schools grade is shown separately in the Schools card above.
Census & demographics
- Census place
- Belmont, CA
- County
- San Mateo County · 733,415 people
- City population
- 27,534
- Metro
- San Francisco-Oakland-Berkeley, CA
- Population (ZIP)
- 27,534
- Household income
- $203,965
- Rent vs Own
- Severe rent burden
- 939.0
Population outlook (San Mateo County) Hauer SSP2
- Today (2025)
- 864,008 people
- By 2030
- 910,523 · +5.4%
- By 2040
- 997,285 · +15.4%
- By 2050
- 1,071,189 · +24.0%
- By 2075
- 1,197,206 · +38.6%
- By 2100
- 1,192,523 · +38.0%
Race, ethnicity, and origin ACS 2023
- Neighborhood character
- Diverse neighborhood (Simpson 0.68)
- Race & ethnicity
- White 46% Asian 29% Hispanic / Latino 14% Two or more races 10% Black 2% Pacific Islander 1%
- Hispanic origin (detail)
- Mexican 6%
- Common ancestry
- Lithuanian 3% Slovak 2% Scotch-Irish 2%
- Foreign-born
- 31% · China, Canada, Vietnam
- Languages at home
- 62% English-only · Spanish 10% Chinese 9% Other Indo-European 6%
Political lean MEDSL · San Mateo
- 2024 margin
- Solid D (+50.3) · D 73.5% · R 23.2% · Other 3.3%
- 2008→2024 swing
- +1.6pp toward D · 2008: 48.7pp · 2024: 50.3pp
- All cycles
- 2024: D+50.3 2020: D+57.7 2016: D+57.7 2012: D+44.8 2008: D+48.7
Not yet ingested
- Civics
- —
Market trends
- HPI YoY
- ▲ 6.23%
- Current HPI
- 376.2038
- Rent YoY
- ▲ 4.56%
- Metro
- San Francisco-Oakland-Berkeley, CA
- State GDP YoY
- ▲ 3.21%
- F500 in state
- 116
Industry mix (Fortune 500 HQ in CA)
| Industry | F500 HQs | Revenue |
|---|---|---|
| Technology | 27 | $1,492B |
|
||
| Financial Services | 3 | $174B |
|
||
| Retail | 3 | $44B |
|
||
| Insurance | 3 | $26B |
|
||
| Media / Entertainment | 2 | $115B |
|
||
| Pharmaceuticals / Biotech | 2 | $62B |
|
||
Price history
+3038.1% since first listed9 events — show timeline
- 2026-05-01 Price Changed $3,750,000 bridgeMLS, Bay East AOR, or Contra Costa AOR
- 2026-05-01 Price Changed $3,750,000 MLSListings
- 2026-04-19 Price Changed $3,895,000 bridgeMLS, Bay East AOR, or Contra Costa AOR
- 2026-04-19 Price Changed $3,895,000 MLSListings
- 2026-04-08 Listing Removed — bridgeMLS, Bay East AOR, or Contra Costa AOR
- 2026-04-08 Listing Removed — bridgeMLS, Bay East AOR, or Contra Costa AOR
- 2026-04-07 Listed $3,950,000 MLSListings
- 2026-04-07 Listed $3,950,000 bridgeMLS, Bay East AOR, or Contra Costa AOR
- 1971-03-05 Sold (Public Records) $119,500 Public Records
Property tax history
+4.8%/yrLatest (2025): $16,157 · +0.7% YoY. Source: county tax records.
Cash-flow waterfall
monthlySold comps — $/sqft
last 12 mo · ≤1 miLoading sold comps…