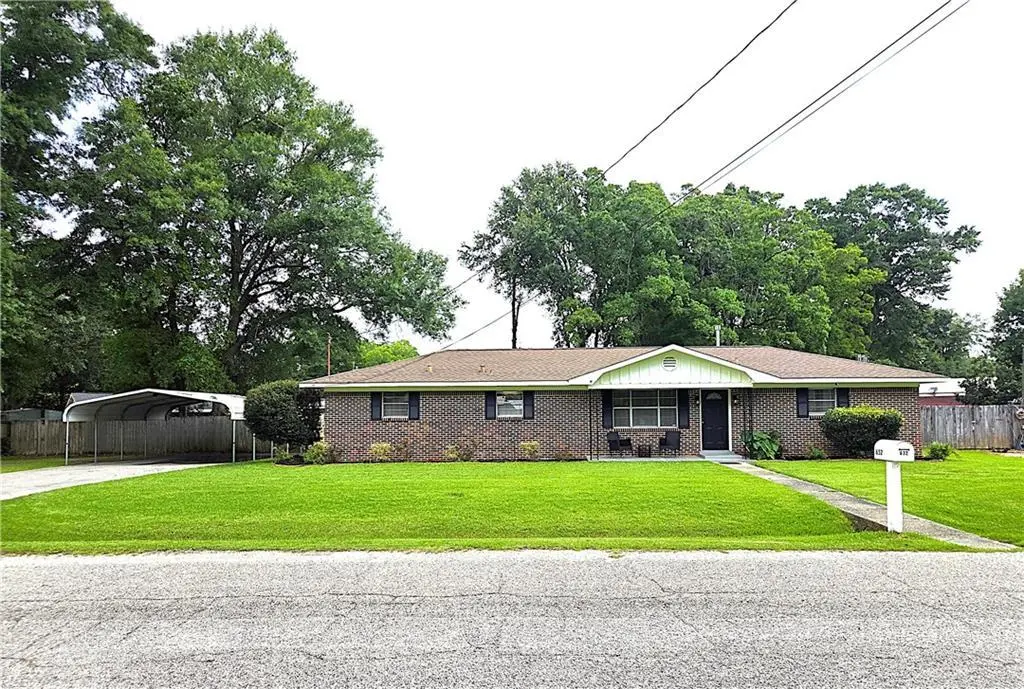
632 Gilbert St
Saraland, AL 36571
$230,000D
3 bd · 1.5 ba ·
1,536 sqft ·
Built 1963
· SingleFamily
· Pending
· 10 DOM
Cashflow @ list (25.0% down · 7.5%)
Estimated rent
$1,702/mo
Mortgage (P&I)
−$1,206
Tax + insurance
−$158
HOA
−$0
Vac / Maint / Mgmt
−$357
Net cashflow
$-20/mo
Annual
$-235/yr
Cap rate
6.19%
Cash-on-cash
-0.36%
DSCR
0.98
1% rule
0.74%
Cash to close
$64,400
Investor read
- This is a 3-bed/1.5-bath single-family listed at $230k.
- At list price, monthly cash flow is $-20 ($-235/yr) — negative.
- To cash-flow at today's rent, offer at most $227k (1.5% below list).
- To meet the 1% rule (rent ≥ 1% of price), the offer needs to be $170k (26.0% below list).
- Only 10 days on market — expect competitive offers; lowballing is unlikely to land.
- Recommended offer: $170k (26.0% below list) — sets the bar for 1% rule.
- Local home prices are declining (-3.0%/yr); year-one equity from $2k of loan paydown is wiped out by about $7k of value loss. Plan a longer hold.
- Location reads 68/100 on livability (#72 in AL) — a middle-class / working-renter tenant base. Strengths: cost of living A+, housing A+, crime A; Watch: amenities F, commute F, health & safety F.
- Saraland City (suburban): math 53% / reading 71% proficiency, ranked #6 of 129 in AL (top 5%) — acceptable for families but not a draw, mixed tenant base, ~2y average lease.
- Zoned schools: Saraland Elementary School (math 71% / reading 82%, grade A, #12 of 627 statewide, top 2%, 958 students, 49% FRL); Saraland High School (math 34% / reading 48%, grade F, #31 of 305 statewide, top 10%, 1,096 students, 50% FRL).
- Market conditions: 173 active listings in the ZIP; 2 comparable units currently listed for rent nearby; 1,678 units permitted in Mobile County in 2024 (264 in 5+ unit buildings).
- Mobile County population projected to shrink 8% by 2050 — rents likely to lag national; underwrite the cash flow, not the appreciation.
- Current owner paid $125k; list at $230k implies a 84% gain — meaningful room to come down on a strong offer.
- Climate carrying-cost: severe wind risk, 99% chance of damaging wind over 30y; extreme-heat days projected 7→21/yr by 2055 (HVAC capex compounding) — expect insurance premiums to compound above CPI over the hold.
- Cap rate 6.2% vs local median 3.9% in Saraland — top-decile yield for the area; either an underpriced asset or a hidden risk that comps aren't pricing in. Stress-test before assuming the spread holds.
- This rent runs 33% of the median local income ($62k/yr) — at the standard rent-burdened threshold; future hikes will face affordability resistance.
Questions for listing agent
- What do current leases actually rent for vs. the listed asking? Can we see a recent rent roll and the last 12 months of T-12 income?
- Built in 1963 — when were the roof, HVAC, electrical panel, plumbing, and water heater last replaced?
- Is there a deadline driving the sale (1031 exchange, divorce, estate, relocation)? That informs how much negotiation room exists.
- The area grade is low — what's the realistic commute time and amenity access for the typical tenant pool here? Any planned neighborhood developments (good or bad) we should know about?
- What's the average days-on-market for RENTAL listings here right now (not sales)? A rising rental-DOM trend means longer vacancies and softer asking-rent achievability than the comps imply.
- What's the recent tenant-quality profile in this submarket — average credit score on applications, eviction rate, late-payment / NSF rate, and stable-employment percentage? A property-management company in the area should have these aggregated.
- How much new for-sale + rental construction is in the pipeline within 1–3 miles? Heavy new supply typically softens prices + rents 12–24 months out; constrained supply supports both.
CashFlowRE · CFR-RHDKWDF8ZC3V3P
· Data 1 day ago
cashflowre.app · 2026-05-29