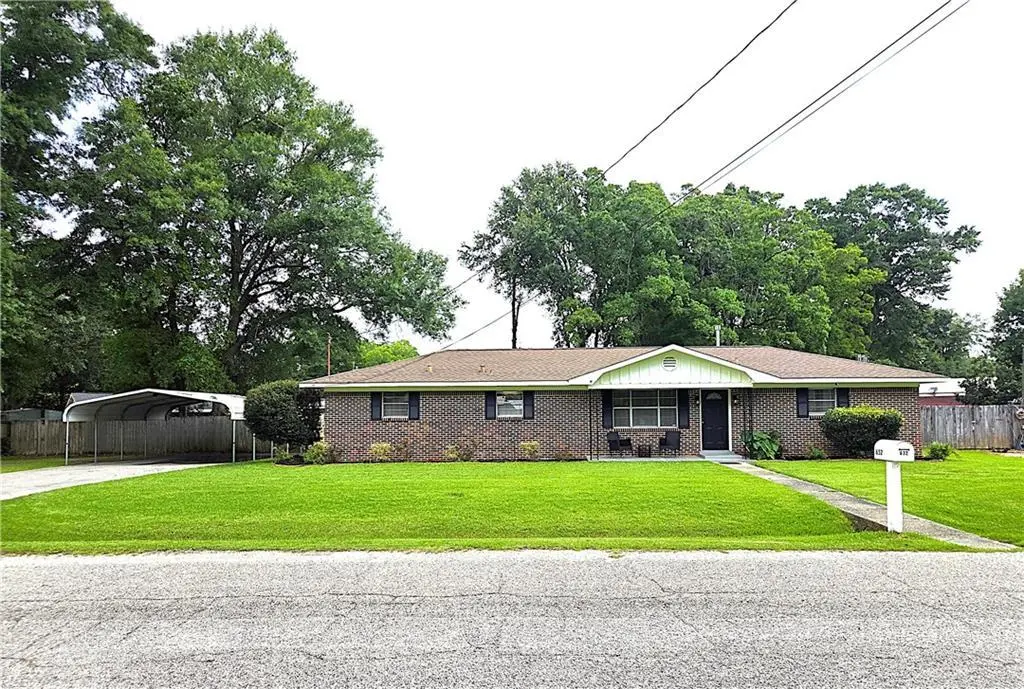
632 Gilbert St · Saraland, AL
Flood risk 1/10 · Minimal
- FEMA flood zone
- X (unshaded)
- Chance of flooding over 30 yrs
- 0.0%
- Est. flood insurance / yr
- $507 – $1,088
Fire risk 3/10 · Minor
- Est. fire insurance / yr
- $916 – $1,700
Heat risk 9/10 · Severe
- Hot days now (above 104°F)
- 7 days/yr
- Hot days in 30 yrs
- 21 days/yr
Wind risk 9/10 · Severe
- Chance of severe wind over 30 yrs
- 99.0%
Air-quality risk 2/10 · Minimal
- Unhealthy air days now
- 1 days/yr
- Unhealthy air days in 30 yrs
- 2 days/yr
Risk factors via First Street. Map © Google.
Why this score? — see what drove the D grade
The composite is a weighted blend of 9 inputs, each scored 0–100. Each bar is that input's sub-score; the figure is the points it added to the 100-point composite (weight × sub-score).
- Cash flow +12.8/30.0
- ARV discount +8.2/15.0
- Schools +5.3/10.0
- DSCR +3.8/10.0
- Livability +3.4/5.0
- Rent growth +2.5/5.0
- Condition / age +2.5/5.0
- 1% rule +2.4/10.0
- Appreciation +0.0/10.0
$230,000
🖨 Deal sheet 📄 Offer letter ✓ Due diligence
Listing remarks
Welcome to this well-maintained brick home in Saraland! This 3-bedroom, 1.5-bath house offers a spacious, open-concept design perfect for both everyday living and entertaining. Inside, you'll find tile flooring throughout, providing durability and easy maintenance. The large kitchen with plenty of cabinets opens into the family room, creating an inviting gathering space for family and friends. Step outside to enjoy the screened back porch, an ideal spot for relaxing with your morning coffee or unwinding in the evening. Great storage building for your mower and tools. The level lot features a privacy-fenced backyard, offering plenty of space for children, pets, outdoor entertaining or grilli
Key facts
- Screened back porch
- Storage building
- Large kitchen
Tags
Property features AI
Exterior
- Parking: Detached carport; 2 carport spaces
- Utilities: Electricity available (110 volts); Natural gas available; Public sewer; Water available
- Home design: Single family residence; Residential property
- Construction: Brick 4 sides construction; Built in 1963; Slab foundation; Shingle roof
- Exterior features: Private yard; Storage; Outbuilding; Back yard privacy fencing
Interior
- Kitchen: White cabinets; Eat-in kitchen; Kitchen island; Pantry; View to family room; Electric range; Microwave
- Bedrooms: 3 bedrooms
- Flooring: Vinyl flooring
- Bathrooms: 1 full bathroom; 1 half bathroom
- Heating & cooling: Central heating; Central air conditioning; Ceiling fan(s)
- Interior features: Open floorplan between dining and living areas; Other interior features
Neighborhood map
What this means for you Summary
Snapshot
- This is a 3-bed/1.5-bath single-family listed at $230k.
Deal economics
- At list price, monthly cash flow is $-20 ($-235/yr) — negative.
- To cash-flow at today's rent, offer at most $227k (1.5% below list).
- To meet the 1% rule (rent ≥ 1% of price), the offer needs to be $170k (26.0% below list).
- Recommended offer: $170k (26.0% below list) — sets the bar for 1% rule.
- Cap rate 6.2% vs local median 3.9% in Saraland — top-decile yield for the area; either an underpriced asset or a hidden risk that comps aren't pricing in. Stress-test before assuming the spread holds.
Location & tenants
- Location reads 68/100 on livability (#72 in AL) — a middle-class / working-renter tenant base. Strengths: cost of living A+, housing A+, crime A; Watch: amenities F, commute F, health & safety F.
- Saraland City (suburban): math 53% / reading 71% proficiency, ranked #6 of 129 in AL (top 5%) — acceptable for families but not a draw, mixed tenant base, ~2y average lease.
- Zoned schools: Saraland Elementary School (math 71% / reading 82%, grade A, #12 of 627 statewide, top 2%, 958 students, 49% FRL); Saraland High School (math 34% / reading 48%, grade F, #31 of 305 statewide, top 10%, 1,096 students, 50% FRL).
- Market conditions: 173 active listings in the ZIP; 2 comparable units currently listed for rent nearby; 1,678 units permitted in Mobile County in 2024 (264 in 5+ unit buildings).
- This rent runs 33% of the median local income ($62k/yr) — at the standard rent-burdened threshold; future hikes will face affordability resistance.
Forward outlook
- Local home prices are declining (-3.0%/yr); year-one equity from $2k of loan paydown is wiped out by about $7k of value loss. Plan a longer hold.
- Mobile County population projected to shrink 8% by 2050 — rents likely to lag national; underwrite the cash flow, not the appreciation.
Negotiation context
- Only 10 days on market — expect competitive offers; lowballing is unlikely to land.
- Current owner paid $125k; list at $230k implies a 84% gain — meaningful room to come down on a strong offer.
Risks & watch-outs
- Climate carrying-cost: severe wind risk, 99% chance of damaging wind over 30y; extreme-heat days projected 7→21/yr by 2055 (HVAC capex compounding) — expect insurance premiums to compound above CPI over the hold.
Questions for the listing agent
- What do current leases actually rent for vs. the listed asking? Can we see a recent rent roll and the last 12 months of T-12 income?
- Built in 1963 — when were the roof, HVAC, electrical panel, plumbing, and water heater last replaced?
- Is there a deadline driving the sale (1031 exchange, divorce, estate, relocation)? That informs how much negotiation room exists.
- The area grade is low — what's the realistic commute time and amenity access for the typical tenant pool here? Any planned neighborhood developments (good or bad) we should know about?
- What's the average days-on-market for RENTAL listings here right now (not sales)? A rising rental-DOM trend means longer vacancies and softer asking-rent achievability than the comps imply.
- What's the recent tenant-quality profile in this submarket — average credit score on applications, eviction rate, late-payment / NSF rate, and stable-employment percentage? A property-management company in the area should have these aggregated.
- How much new for-sale + rental construction is in the pipeline within 1–3 miles? Heavy new supply typically softens prices + rents 12–24 months out; constrained supply supports both.
Investment metrics
- 1% rule
- 0.74% ✗
- Cap rate
- 6.19%
- Cash-on-cash
- -0.36%
- DSCR
- 0.98
- GRM
- 11.3
CMA / ARV
- ARV (on-the-fly)
- $233,472
- Comps found
- 12
Show comp detail 12 sales within ~0.75 mi
| Address | Dist | Beds/Ba | Sqft | Sold | Price | $/sf | Match |
|---|---|---|---|---|---|---|---|
| 711 Ann St | 0.10mi | 4/2.0 (+1) | 1,551 (+1%) | 1mo | $237,000 | $153 | 86 |
| 705 Gilbert St | 0.04mi | 3/2.0 | 1,400 (-9%) | 4mo | $201,100 | $144 | 78 |
| 328 Villa Oaks Dr | 0.43mi | 3/1.5 | 1,534 (-0%) | 3mo | $215,500 | $140 | 77 |
| 717 Ann St | 0.09mi | 3/2.0 | 1,404 (-9%) | 3mo | $217,500 | $155 | 77 |
| 221 Bemis St | 0.52mi | 3/2.0 | 1,524 (-1%) | 3mo | $279,900 | $184 | 70 |
| 219 Bemis St | 0.53mi | 3/2.0 | 1,524 (-1%) | 4mo | $279,900 | $184 | 69 |
| 429 1st Ave | 0.35mi | 3/2.0 | 1,680 (+9%) | 5mo | $145,000 | $86 | 62 |
| 807 Timber Ln | 0.43mi | 3/2.0 | 1,726 (+12%) | 2mo | $262,000 | $152 | 55 |
| 205 Stauffer Ave | 0.64mi | 4/2.0 (+1) | 1,458 (-5%) | 1mo | $185,000 | $127 | 54 |
| 323 1st Ave | 0.52mi | 3/1.5 | 1,353 (-12%) | 6mo | $120,000 | $89 | 51 |
| 159 Courtaulds Ave W | 0.53mi | 4/2.0 (+1) | 1,741 (+13%) | 1mo | $230,000 | $132 | 45 |
| 519 Villa Oaks Dr | 0.43mi | 3/3.5 | 1,750 (+14%) | 6mo | $395,000 | $226 | 44 |
Match score weights: distance 35% · size 25% · config 20% · recency 20%. Top-matched comps best support the ARV.
Projected returns pro-forma
-3.0% appreciation · 3.0% rent growth · sell at horizon
- IRR
- -17.0%
- Equity multiple
- 0.40×
- Total profit
- $-38,629
- Equity at exit
- $34,294
- IRR
- -9.0%
- Equity multiple
- 0.45×
- Total profit
- $-35,700
- Equity at exit
- $19,886
Cash invested: $64,400 (down + closing). Projections, not guarantees.
Landlord ↔ Tenant lean methodology
- Overall (STATE)
- 90 Strongly Landlord-Friendly
- State Alabama
- 90 Strongly Landlord-Friendly · R+15
- County
- — inherits STATE
- City
- — inherits STATE
ZIP-level market 36571
- Home prices YoY
- -13.1%
- Active inventory
- 173
- Price-to-rent
- 11.3×
Monthly cashflow live
- Estimated rent
- $1,702 medium interval (Pro) →
- Mortgage (P&I)
- −$1,206
- Tax from tax record
- −$62 /mo · $746/yr
- Insurance
- −$96
- HOA
- −$0
- Vacancy / Maint / Mgmt
- −$357
- Net cashflow
- $-20
Break-even live
UW: 25.0% down · 7.5% · 30yr · 1.5% tax · 5.0% vac · 8.0% maint · 8.0% mgmt
Financing live
Cash to close
- Down payment
- $57,500
- Closing costs
- $6,900
- Reserves months
- —
- Total cash needed
- —
Loan-product check · same deal, 3 products live
Conventional
25% down · 7.5% · 30yr
- Down + closing
- —
- Monthly P&I
- —
- Monthly cashflow
- —
- DSCR
- —
- Eligible?
- —
Personal DTI + credit; lowest rate.
DSCR
20% down · 8.5% · 30yr
- Down + closing
- —
- Monthly P&I
- —
- Monthly cashflow
- —
- DSCR
- —
- Eligible?
- —
No personal income docs; deal must DSCR.
Hard money
10% down · 12.0% · 12mo
- Down + closing
- —
- Monthly P&I
- —
- Monthly cashflow
- —
- DSCR
- —
- Eligible?
- —
Short-term bridge; refi at stabilization.
Rent comps 2 comps
| Address | Beds | Baths | Sqft | Rent | $/sqft | DOM | Units | Dist |
|---|---|---|---|---|---|---|---|---|
| 831 James St Saraland, AL | 3.0 | 1.0 | 1300 | $1,600 | $1.23 | 13d | 1 | 0.39mi |
| 916 Shelton Beach Rd Saraland, AL | 4.0 | 2.0 | 1713 | $1,950 | $1.14 | 13d | 1 | 0.43mi |
Listing history 10 events
-
2026-06-19status $230,000 Pending 10 DOM
-
2026-06-18days on market $230,000 Active 10 DOM
-
2026-06-17days on market $230,000 Active 9 DOM
-
2026-06-16days on market $230,000 Active 8 DOM
-
2026-06-15days on market $230,000 Active 7 DOM
-
2026-06-14days on market $230,000 Active 5 DOM
-
2026-06-13days on market $230,000 Active 4 DOM
-
2026-06-10days on market $230,000 Active 2 DOM
-
2026-06-09remarks 699-char remark
-
2026-06-09$230,000 Active 1 DOM
ⓘ Source: listings_history table (triggers on properties + properties_extension) + one-shot
backfill from property_details.listing_events for pre-trigger history.
Tax reassessment forecast AL · Resets to sale price
- Current annual tax
- $746 · $62/mo
- Projected year-2 tax
- $943 · $79/mo
- Expected delta
- +$197/yr (+$16/mo · 26.4%)
ⓘ Screening estimate from a state-policy table — verify with the county assessor before closing.
Climate risk First Street
- Flood 1/10 Low FEMA zone X (unshaded) · 0% chance over 30 yrs
- Wildfire 3/10 Moderate
- Heat 9/10 Extreme 7 d/yr ≥104°F today · 21 d/yr by 30 yrs out
- Wind 9/10 Extreme 99% chance of damaging wind over 30 yrs
- Air quality 2/10 Low 1 unhealthy d/yr today · 2 by 30 yrs out
Nearby sold comps map
Loading sold comps map…
Walkable amenities ~0.75 mi
Loading nearby amenities…
Taxation est. · year 1
- Rental income
- $20,424
- − Mortgage interest
- −$12,884
- − Property taxes
- −$746
- − Insurance
- −$1,150
- − Repairs & maintenance
- −$1,634
- − Management
- −$1,634
- − Depreciation
- −$6,691
- Taxable loss
- −$4,314
- Est. tax savings @ 24.0%
- +$1,035
- After-tax cash flow
- $801/yr
For passive investors: Depreciation is non-cash, so a rental often shows a tax loss while cash-flowing — sheltering income. Rental losses are passive: they offset passive income freely, and up to $25,000/yr can offset ordinary (W-2) income if you actively participate and your MAGI is under $100k (phasing out to $0 by $150k); unused losses carry forward. On sale, claimed depreciation is recaptured at up to 25%, and gains may owe capital-gains tax (a 1031 exchange can defer both). Figures are a year-1 estimate at your 24.0% rate — not tax advice; consult a CPA.
Schools (NCES district)
- District
- Saraland City
- NCES district ID
- 0100185
- Math proficiency
- 53% ▼ -16.00%
- Reading proficiency
- 71% ▲ 7.00%
- Median HH income
- $51,173
- Composite
- 52.78/100
- National rank
- #1539
- State rank
- #6 of 129 in AL
Livability — Saraland
- Score
- 68/100
- State rank
- #72
- US rank
- #9880
Category grades
Schools grade is shown separately in the Schools card above.
Census & demographics
- Census place
- Saraland, AL
- County
- Mobile County · 246,577 people
- City population
- 17,143
- Metro
- Mobile, AL
- Population (ZIP)
- 17,143
- Household income
- $62,047
- Rent vs Own
- Severe rent burden
- 432.0
Population outlook (Mobile County) Hauer SSP2
- Today (2025)
- 415,303 people
- By 2030
- 411,755 · -0.9%
- By 2040
- 399,670 · -3.8%
- By 2050
- 382,616 · -7.9%
- By 2075
- 337,353 · -18.8%
- By 2100
- 283,391 · -31.8%
Race, ethnicity, and origin ACS 2023
- Neighborhood character
- Predominantly White (79%)
- Race & ethnicity
- White 79% Black 16% Two or more races 3%
- Common ancestry
- Italian 3% Lithuanian 2% Slovak 2%
- Foreign-born
- 1% · China
Political lean MEDSL · Mobile
- 2024 margin
- R (+16.4) · D 41.3% · R 57.7%
- 2008→2024 swing
- -7.7pp toward R · 2008: -8.7pp · 2024: -16.4pp
- All cycles
- 2024: R+16.4 2020: R+11.9 2016: R+13.9 2012: R+9.3 2008: R+8.7
Not yet ingested
- Civics
- —
Market trends
- HPI YoY
- ▼ -37.39%
- Current HPI
- 247.8527
- Rent YoY
- —
- Metro
- Mobile, AL
- State GDP YoY
- ▲ 2.94%
- F500 in state
- 4
Industry mix (Fortune 500 HQ in AL)
| Industry | F500 HQs | Revenue |
|---|---|---|
| Financial Services | 1 | $8B |
|
||
| Healthcare | 1 | $5B |
|
||
Price history
+89.4% since first listed3 events — show timeline
- 2026-06-09 Listed $230,000 GCMLS AL
- 2019-05-28 Sold (Public Records) $124,920 Public Records
- 2008-11-21 Sold (Public Records) $121,450 Public Records
Property tax history
+5.9%/yrLatest (2025): $746 · +4.5% YoY. Source: county tax records.
Cash-flow waterfall
monthlySold comps — $/sqft
last 12 mo · ≤1 miLoading sold comps…