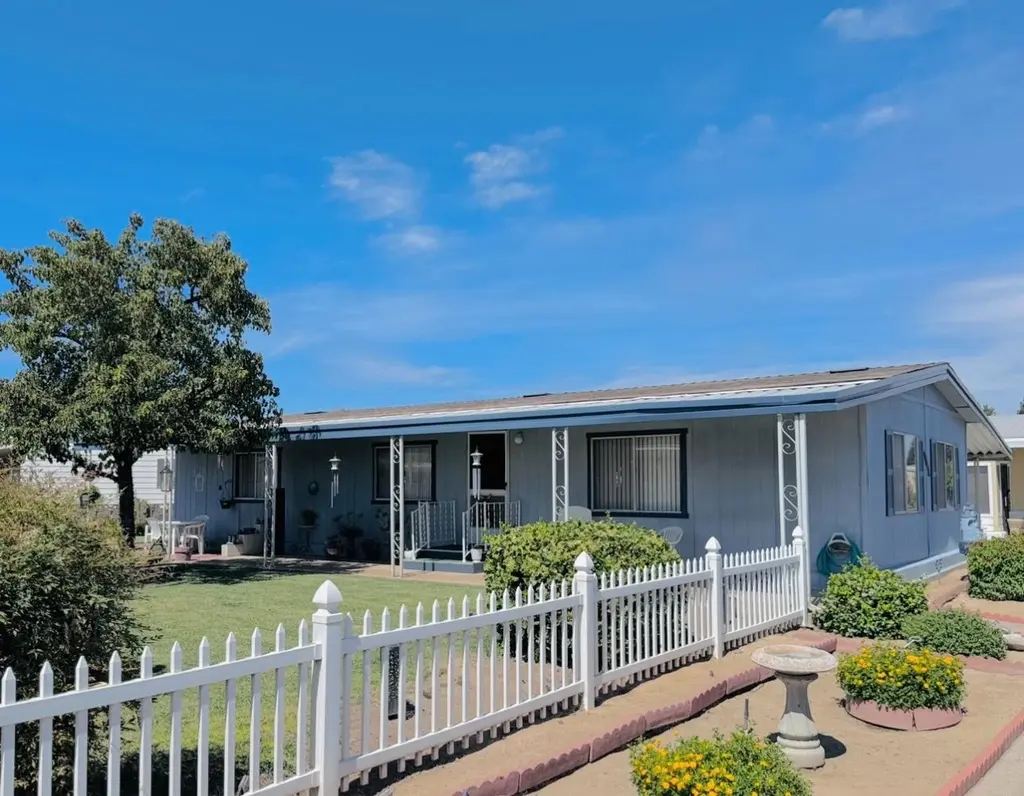
1701 Dinuba Ave #140
Selma, CA 93662
$70,000B
2 bd · 2.0 ba ·
1,248 sqft ·
Built 1981
· Manufactured
· Active
· 6 DOM
Cashflow @ list (25.0% down · 7.5%)
Estimated rent
$1,853/mo
Mortgage (P&I)
−$367
Tax + insurance
−$117
HOA
−$615
Vac / Maint / Mgmt
−$389
Net cashflow
$365/mo
Annual
$4,380/yr
Cap rate
12.55%
Cash-on-cash
22.35%
DSCR
1.99
1% rule
2.65%
Cash to close
$19,600
Investor read
- This is a 2-bed/2.0-bath manufactured listed at $70k.
- At list price, monthly cash flow is $365 ($4k/yr) — positive.
- The deal already cash-flows at list — no discount required.
- Meets the 1% rule at list price ($2k rent vs $70k).
- Only 6 days on market — expect competitive offers; lowballing is unlikely to land.
- Local home prices are declining (-3.0%/yr); year-one equity from $484 of loan paydown is wiped out by about $2k of value loss. Plan a longer hold.
- Location reads 59/100 on livability (#658 in CA) — a working-class tenant base; expect higher turnover. Strengths: housing A-, commute B+; Watch: crime F, amenities F, employment F.
- Selma Unified (town): math 20% / reading 58% proficiency, ranked #250 of 517 in CA (top 48%) — families likely to look elsewhere, expect single-tenant / working-renter base with shorter leases; 73% free/reduced lunch — lower-income household profile, screen leases tightly.
- Zoned schools: Indianola Elementary (math 24% / reading 24%, grade F, #973 of 1,571 statewide, top 73%, 354 students, 88% FRL); Abraham Lincoln Middle (math 24% / reading 24%, grade F, #277 of 498 statewide, top 73%, 888 students, 91% FRL); Selma High (math 22% / reading 63%, grade F, #466 of 1,170 statewide, top 40%, 1,742 students, 88% FRL) — zoned schools average 89% FRL vs 73% district-wide (16 pts higher); higher-poverty schools than district average — tighter screening recommended.
- Watch-outs: HOA is 33% of rent.
- Market conditions: 60 active listings in the ZIP; 1 comparable units currently listed for rent nearby; 2,426 units permitted in Fresno County in 2024 (296 in 5+ unit buildings).
- Fresno County population projected at +11% by 2050 — modest demand growth; plan on rents tracking national, not racing it.
- At projected returns (-3.0% appreciation + 3.0% rent growth), your $20k cash investment doubles in ~6 years — after that, you're playing with house money.
- Climate carrying-cost: moderate wildfire risk; extreme-heat days projected 6→15/yr by 2055 (HVAC capex compounding) — expect insurance premiums to compound above CPI over the hold.
- Cap rate 12.6% vs local median 4.8% in Selma — top-decile yield for the area; either an underpriced asset or a hidden risk that comps aren't pricing in. Stress-test before assuming the spread holds.
- This rent runs 36% of the median local income ($62k/yr) — at the standard rent-burdened threshold; future hikes will face affordability resistance.
Questions for listing agent
- What does the HOA fee cover, when was the last increase, and are there any pending special assessments or reserve-fund shortfalls?
- Is there a deadline driving the sale (1031 exchange, divorce, estate, relocation)? That informs how much negotiation room exists.
- Schools are D-rated, which usually means shorter tenancies and higher turnover. Who's the typical renter profile here, and what's been the actual vacancy rate?
- Crime grade is F in this area — have there been break-ins, vandalism, or insurance claims at this property in the last 3 years? What carrier currently insures it and at what premium?
- What's the average days-on-market for RENTAL listings here right now (not sales)? A rising rental-DOM trend means longer vacancies and softer asking-rent achievability than the comps imply.
- What's the recent tenant-quality profile in this submarket — average credit score on applications, eviction rate, late-payment / NSF rate, and stable-employment percentage? A property-management company in the area should have these aggregated.
- How much new for-sale + rental construction is in the pipeline within 1–3 miles? Heavy new supply typically softens prices + rents 12–24 months out; constrained supply supports both.
CashFlowRE · CFR-RHG7NV22ESS5MZ
· Data 2 days ago
cashflowre.app · 2026-05-29