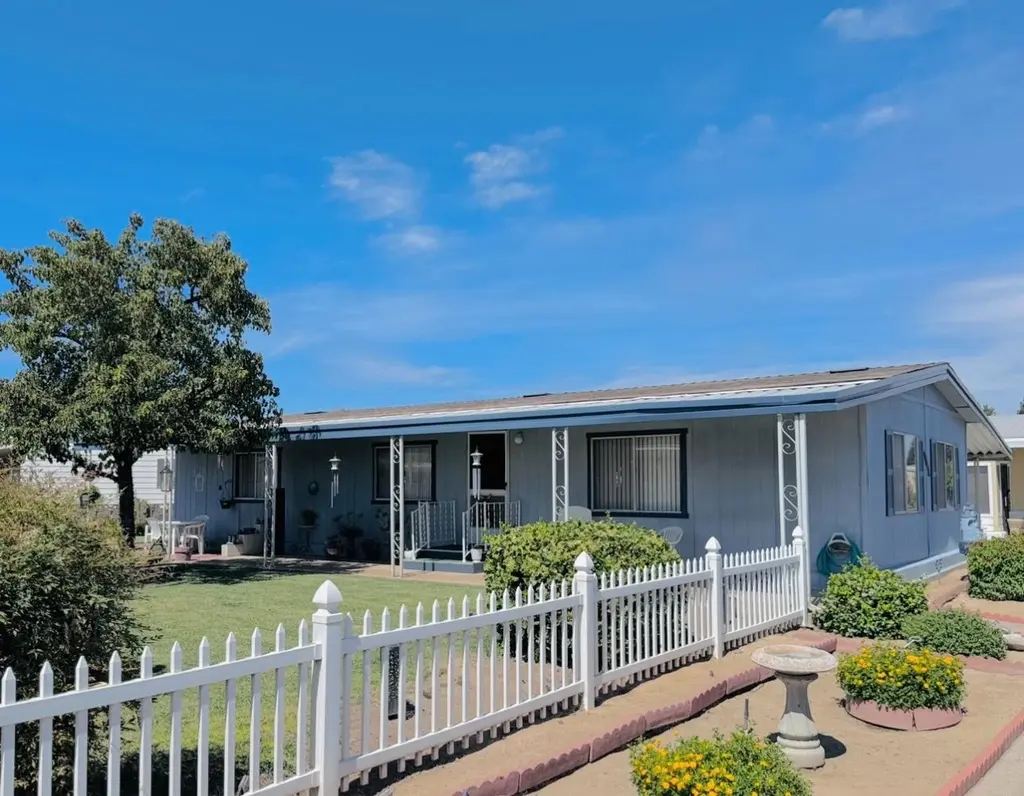
1701 Dinuba Ave #140 · Selma, CA
Flood risk 1/10 · Minimal
- FEMA flood zone
- X (unshaded)
- Chance of flooding over 30 yrs
- 0.0%
- Est. flood insurance / yr
- $507 – $1,088
Fire risk 5/10 · Moderate
- Est. fire insurance / yr
- $659 – $1,223
Heat risk 7/10 · Major
- Hot days now (above 105°F)
- 6 days/yr
- Hot days in 30 yrs
- 15 days/yr
Wind risk 1/10 · Minimal
- Chance of severe wind over 30 yrs
- —
Air-quality risk 10/10 · Severe
- Unhealthy air days now
- 41 days/yr
- Unhealthy air days in 30 yrs
- 45 days/yr
Risk factors via First Street. Map © Google.
Why this score? — see what drove the B grade
The composite is a weighted blend of 9 inputs, each scored 0–100. Each bar is that input's sub-score; the figure is the points it added to the 100-point composite (weight × sub-score).
- Cash flow +30.0/30.0
- ARV discount +12.4/15.0
- 1% rule +10.0/10.0
- DSCR +10.0/10.0
- Schools +3.3/10.0
- Livability +3.0/5.0
- Rent growth +2.5/5.0
- Condition / age +2.5/5.0
- Appreciation +0.0/10.0
$70,000
🖨 Deal sheet 📄 Offer letter ✓ Due diligence
Listing remarks
Welcome to this beautifully maintained manufactured home in the desirable McCall Village Mobile Park 55+ Community! This immaculate 2-bedroom, 2-bath offers a spacious and inviting floor plan filled with natural light. The large kitchen provides plenty of counter space and cabinetry. Enjoy the comfort of generous living areas, ample storage throughout, and a convenient storage shed for all your extra belongings. Situated on a spacious lot, this home offers room to relax and enjoy outdoor living while benefiting from the peaceful surroundings of the community. Move-in ready and exceptionally cared for, this is a wonderful opportunity to enjoy comfortable, low-maintenance living.
Key facts
- Large kitchen
- Storage shed
- Spacious lot
Tags
Property features AI
Finance
- HOA & community: Association with clubhouse and pool; Association fee $615 monthly
Exterior
- Parking: Carport / has carport
- Utilities: Electric on; Public sewer; Public utilities
- Home design: Mobile home (Madison); Park space is rented
- Construction: Vinyl siding; Composition roof; Concrete foundation
- Exterior features: One-level; Covered patio/porch; Urban lot setting; Private pool (community in-ground pool indicated)
Interior
- Bathrooms: 2 bathrooms; Tub/shower
- Heating & cooling: Central heat and air conditioning; Heating present; Cooling present
- Interior features: Indoor laundry
- Laundry & utility: Laundry located inside
Neighborhood map
What this means for you Summary
Snapshot
- This is a 2-bed/2.0-bath manufactured listed at $70k.
Deal economics
- At list price, monthly cash flow is $365 ($4k/yr) — positive.
- The deal already cash-flows at list — no discount required.
- Meets the 1% rule at list price ($2k rent vs $70k).
- Cap rate 12.6% vs local median 4.8% in Selma — top-decile yield for the area; either an underpriced asset or a hidden risk that comps aren't pricing in. Stress-test before assuming the spread holds.
Location & tenants
- Location reads 59/100 on livability (#658 in CA) — a working-class tenant base; expect higher turnover. Strengths: housing A-, commute B+; Watch: crime F, amenities F, employment F.
- Selma Unified (town): math 20% / reading 58% proficiency, ranked #250 of 517 in CA (top 48%) — families likely to look elsewhere, expect single-tenant / working-renter base with shorter leases; 73% free/reduced lunch — lower-income household profile, screen leases tightly.
- Zoned schools: Indianola Elementary (math 24% / reading 24%, grade F, #973 of 1,571 statewide, top 73%, 354 students, 88% FRL); Abraham Lincoln Middle (math 24% / reading 24%, grade F, #277 of 498 statewide, top 73%, 888 students, 91% FRL); Selma High (math 22% / reading 63%, grade F, #466 of 1,170 statewide, top 40%, 1,742 students, 88% FRL) — zoned schools average 89% FRL vs 73% district-wide (16 pts higher); higher-poverty schools than district average — tighter screening recommended.
- Market conditions: 60 active listings in the ZIP; 1 comparable units currently listed for rent nearby; 2,426 units permitted in Fresno County in 2024 (296 in 5+ unit buildings).
- This rent runs 36% of the median local income ($62k/yr) — at the standard rent-burdened threshold; future hikes will face affordability resistance.
Forward outlook
- Local home prices are declining (-3.0%/yr); year-one equity from $484 of loan paydown is wiped out by about $2k of value loss. Plan a longer hold.
- Fresno County population projected at +11% by 2050 — modest demand growth; plan on rents tracking national, not racing it.
- At projected returns (-3.0% appreciation + 3.0% rent growth), your $20k cash investment doubles in ~6 years — after that, you're playing with house money.
Negotiation context
- Only 6 days on market — expect competitive offers; lowballing is unlikely to land.
Risks & watch-outs
- Watch-outs: HOA is 33% of rent.
- Climate carrying-cost: moderate wildfire risk; extreme-heat days projected 6→15/yr by 2055 (HVAC capex compounding) — expect insurance premiums to compound above CPI over the hold.
Questions for the listing agent
- What does the HOA fee cover, when was the last increase, and are there any pending special assessments or reserve-fund shortfalls?
- Is there a deadline driving the sale (1031 exchange, divorce, estate, relocation)? That informs how much negotiation room exists.
- Schools are D-rated, which usually means shorter tenancies and higher turnover. Who's the typical renter profile here, and what's been the actual vacancy rate?
- Crime grade is F in this area — have there been break-ins, vandalism, or insurance claims at this property in the last 3 years? What carrier currently insures it and at what premium?
- What's the average days-on-market for RENTAL listings here right now (not sales)? A rising rental-DOM trend means longer vacancies and softer asking-rent achievability than the comps imply.
- What's the recent tenant-quality profile in this submarket — average credit score on applications, eviction rate, late-payment / NSF rate, and stable-employment percentage? A property-management company in the area should have these aggregated.
- How much new for-sale + rental construction is in the pipeline within 1–3 miles? Heavy new supply typically softens prices + rents 12–24 months out; constrained supply supports both.
Investment metrics
- 1% rule
- 2.65% ✓
- Cap rate
- 12.55%
- Cash-on-cash
- 22.35%
- DSCR
- 1.99
- GRM
- 3.1
CMA / ARV
- ARV (on-the-fly)
- $78,624
- Comps found
- 12
Show comp detail 12 sales within ~0.75 mi
| Address | Dist | Beds/Ba | Sqft | Sold | Price | $/sf | Match |
|---|---|---|---|---|---|---|---|
| 1701 Dinuba Ave Spc 56 | 0.00mi | 2/2.0 | 1,248 (0%) | 2mo | $68,000 | $54 | 99 |
| 1701 Dinuba Ave Spc 56 | 0.00mi | 2/2.0 | 1,248 (0%) | 2mo | $68,000 | $54 | 99 |
| 1701 Dinuba Ave #83 | 0.00mi | 2/2.0 | 1,152 (-8%) | 11mo | $82,500 | $72 | 78 |
| 1701 Dinuba Ave #83 | 0.00mi | 2/2.0 | 1,152 (-8%) | 11mo | $82,500 | $72 | 78 |
| 1701 Dinuba Ave #42 | 0.00mi | 2/2.0 | 1,344 (+8%) | 13mo | $45,000 | $33 | 76 |
| 1701 Dinuba Ave #141 | 0.00mi | 3/2.0 (+1) | 1,248 (0%) | 23mo | $116,000 | $93 | 76 |
| 1701 E Dinuba Ave #52 | 0.09mi | 2/2.0 | 1,200 (-4%) | 16mo | $50,000 | $42 | 76 |
| 1701 Dinuba Ave #134 | 0.00mi | 2/2.0 | 1,344 (+8%) | 16mo | $83,000 | $62 | 74 |
| 1701 Dinuba Ave #174 | 0.09mi | 2/2.0 | 1,152 (-8%) | 14mo | $80,000 | $69 | 71 |
| 1701 Dinuba Ave #167 | 0.00mi | 2/1.8 | 1,344 (+8%) | 20mo | $85,000 | $63 | 70 |
| 1701 Dinuba Ave #175 | 0.09mi | 2/2.0 | 1,344 (+8%) | 24mo | $88,000 | $65 | 63 |
| 1701 E Dinuba Ave #31 | 0.09mi | 3/2.0 (+1) | 1,400 (+12%) | 22mo | $53,000 | $38 | 52 |
Match score weights: distance 35% · size 25% · config 20% · recency 20%. Top-matched comps best support the ARV.
Projected returns pro-forma
-3.0% appreciation · 3.0% rent growth · sell at horizon
- IRR
- 15.6%
- Equity multiple
- 1.63×
- Total profit
- $12,311
- Equity at exit
- $10,437
- IRR
- 24.5%
- Equity multiple
- 3.16×
- Total profit
- $42,304
- Equity at exit
- $6,052
Cash invested: $19,600 (down + closing). Projections, not guarantees.
Landlord ↔ Tenant lean methodology
- Overall (STATE)
- 18 Strongly Tenant-Friendly
- State California
- 18 Strongly Tenant-Friendly · D+13
- County
- — inherits STATE
- City
- — inherits STATE
ZIP-level market 93662
- Home prices YoY
- -32.6%
- Active inventory
- 60
- Price-to-rent
- 3.1×
Monthly cashflow live
- Estimated rent
- $1,853 medium interval (Pro) →
- Mortgage (P&I)
- −$367
- Tax est. 1.5%
- −$88 /mo · $1,050/yr
- Insurance
- −$29
- HOA
- −$615
- Vacancy / Maint / Mgmt
- −$389
- Net cashflow
- $365
Break-even live
UW: 25.0% down · 7.5% · 30yr · 1.5% tax · 5.0% vac · 8.0% maint · 8.0% mgmt
Financing live
Cash to close
- Down payment
- $17,500
- Closing costs
- $2,100
- Reserves months
- —
- Total cash needed
- —
Loan-product check · same deal, 3 products live
Conventional
25% down · 7.5% · 30yr
- Down + closing
- —
- Monthly P&I
- —
- Monthly cashflow
- —
- DSCR
- —
- Eligible?
- —
Personal DTI + credit; lowest rate.
DSCR
20% down · 8.5% · 30yr
- Down + closing
- —
- Monthly P&I
- —
- Monthly cashflow
- —
- DSCR
- —
- Eligible?
- —
No personal income docs; deal must DSCR.
Hard money
10% down · 12.0% · 12mo
- Down + closing
- —
- Monthly P&I
- —
- Monthly cashflow
- —
- DSCR
- —
- Eligible?
- —
Short-term bridge; refi at stabilization.
Rent comps 1 comps
| Address | Beds | Baths | Sqft | Rent | $/sqft | DOM | Units | Dist |
|---|---|---|---|---|---|---|---|---|
| 1650 Floral Ave Selma, CA | 1.0–2.0 | 1.0 | 800 | $1,799 | $2.25 | 1d | 2 | 0.82mi |
HOA detail
- Monthly dues
- $615 · $7,380/yr
Listing history 6 events
-
2026-06-18days on market $70,000 Active 6 DOM
-
2026-06-17days on market $70,000 Active 5 DOM
-
2026-06-16days on market $70,000 Active 4 DOM
-
2026-06-15days on market $70,000 Active 3 DOM
-
2026-06-13remarks 686-char remark
-
2026-06-13$70,000 Active 1 DOM
ⓘ Source: listings_history table (triggers on properties + properties_extension) + one-shot
backfill from property_details.listing_events for pre-trigger history.
Climate risk First Street
- Flood 1/10 Low FEMA zone X (unshaded) · 0% chance over 30 yrs
- Wildfire 5/10 Major
- Heat 7/10 Severe 6 d/yr ≥105°F today · 15 d/yr by 30 yrs out
- Wind 1/10 Low
- Air quality 10/10 Extreme 41 unhealthy d/yr today · 45 by 30 yrs out
Nearby sold comps map
Loading sold comps map…
Walkable amenities ~0.75 mi
Loading nearby amenities…
Taxation est. · year 1
- Rental income
- $22,234
- − Mortgage interest
- −$3,921
- − Property taxes
- −$1,050
- − Insurance
- −$350
- − Repairs & maintenance
- −$1,779
- − Management
- −$1,779
- − HOA
- −$7,380
- − Depreciation
- −$2,036
- Taxable income
- $3,939
- Est. tax owed @ 24.0%
- −$945
- After-tax cash flow
- $3,435/yr
For passive investors: Depreciation is non-cash, so a rental often shows a tax loss while cash-flowing — sheltering income. Rental losses are passive: they offset passive income freely, and up to $25,000/yr can offset ordinary (W-2) income if you actively participate and your MAGI is under $100k (phasing out to $0 by $150k); unused losses carry forward. On sale, claimed depreciation is recaptured at up to 25%, and gains may owe capital-gains tax (a 1031 exchange can defer both). Figures are a year-1 estimate at your 24.0% rate — not tax advice; consult a CPA.
Schools (NCES district)
- District
- Selma Unified
- NCES district ID
- 0636270
- Math proficiency
- 20% ▼ -3.00%
- Reading proficiency
- 58% ▲ 14.00%
- Median HH income
- $42,026
- Composite
- 32.75/100
- National rank
- #5636
- State rank
- #250 of 517 in CA
Livability — Selma
- Score
- 59/100
- State rank
- #658
- US rank
- #20374
Category grades
Schools grade is shown separately in the Schools card above.
Census & demographics
- Census place
- Selma, CA
- County
- Fresno County · 834,801 people
- City population
- 29,419
- Metro
- Fresno, CA
- Population (ZIP)
- 29,419
- Household income
- $61,564
- Rent vs Own
- Severe rent burden
- 797.0
Population outlook (Fresno County) Hauer SSP2
- Today (2025)
- 1,042,971 people
- By 2030
- 1,072,198 · +2.8%
- By 2040
- 1,122,408 · +7.6%
- By 2050
- 1,157,251 · +11.0%
- By 2075
- 1,182,575 · +13.4%
- By 2100
- 1,105,899 · +6.0%
Race, ethnicity, and origin ACS 2023
- Neighborhood character
- Predominantly Hispanic (79%)
- Race & ethnicity
- Hispanic / Latino 79% Two or more races 19% White 14% Asian 3% Native American 2%
- Hispanic origin (detail)
- Mexican 77%
- Common ancestry
- Russian 1% Iranian 1% Italian 1%
- Foreign-born
- 22% · Canada
- Languages at home
- 50% English-only · Spanish 47% Other Indo-European 3%
Political lean MEDSL · Fresno
- 2024 margin
- Toss-up / Even · D 46.5% · R 50.9% · Other 2.6%
- 2008→2024 swing
- -6.5pp toward R · 2008: 2.1pp · 2024: -4.4pp
- All cycles
- 2024: R+4.4 2020: D+7.8 2016: D+3.9 2012: R+2.9 2008: D+2.1
Not yet ingested
- Civics
- —
Market trends
- HPI YoY
- ▼ -178.57%
- Current HPI
- 369.7645
- Rent YoY
- —
- Metro
- Fresno, CA
- State GDP YoY
- ▲ 3.21%
- F500 in state
- 116
Industry mix (Fortune 500 HQ in CA)
| Industry | F500 HQs | Revenue |
|---|---|---|
| Technology | 27 | $1,492B |
|
||
| Financial Services | 3 | $174B |
|
||
| Retail | 3 | $44B |
|
||
| Insurance | 3 | $26B |
|
||
| Media / Entertainment | 2 | $115B |
|
||
| Pharmaceuticals / Biotech | 2 | $62B |
|
||
Price history
1 event — show timeline
- 2026-06-08 Listed $70,000 FRESNOMLS
Cash-flow waterfall
monthlySold comps — $/sqft
last 12 mo · ≤1 miLoading sold comps…