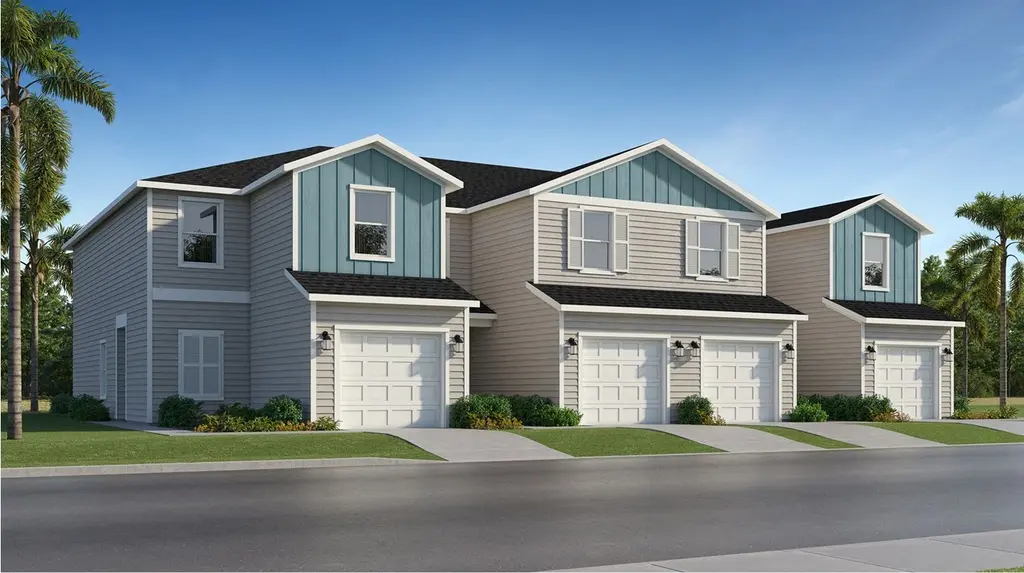
Irving Plan
Liberty Triangle, FL 34476
$217,990D+
3 bd · 2.5 ba ·
1,717 sqft ·
Built —
· Townhouse
· Active
· 76 DOM
Cashflow @ list (25.0% down · 7.5%)
Estimated rent
$2,076/mo
Mortgage (P&I)
−$1,116
Tax + insurance
−$355
HOA
−$0
Vac / Maint / Mgmt
−$436
Net cashflow
$169/mo
Annual
$2,031/yr
Cap rate
7.25%
Cash-on-cash
3.41%
DSCR
1.15
1% rule
0.98%
Cash to close
$59,580
Investor read
- This is a 3-bed/2.5-bath townhouse listed at $218k. Condition is rated good.
- At list price, monthly cash flow is $169 ($2k/yr) — positive.
- The deal already cash-flows at list — no discount required.
- To meet the 1% rule (rent ≥ 1% of price), the offer needs to be $208k (4.8% below list).
- It's been on market 76 days — a 6% lower offer ($205k) is reasonable based on typical stale-listing flexibility.
- Recommended offer: $205k (6.0% below list) — sets the bar for market timing.
- Local home prices are declining (-3.0%/yr); year-one equity from $1k of loan paydown is wiped out by about $6k of value loss. Plan a longer hold.
- Location reads: area grade D — affects rentability + tenant quality, not the cash-flow math above.
- Marion (rural): math 42% / reading 43% proficiency, ranked #61 of 73 in FL (top 84%) — families likely to look elsewhere, expect single-tenant / working-renter base with shorter leases; 61% free/reduced lunch — lower-income household profile, screen leases tightly.
- Zoned schools: Hammett Bowen Jr. Elementary School (math 56% / reading 56%, grade C+, #832 of 2,144 statewide, top 40%, 867 students, 54% FRL); Liberty Middle School (math 40% / reading 41%, grade F, #360 of 571 statewide, top 64%, 1,365 students, 54% FRL); West Port High School (math 34% / reading 52%, grade F, #255 of 667 statewide, top 39%, 2,906 students, 52% FRL).
- Market conditions: Rents soft (-2.6%/yr); 858 active listings in the ZIP; 24 comparable units currently listed for rent nearby; rentals at typical pace (median 16d on market — plan ~3-4 weeks tenant-placement turnaround); 7,071 units permitted in Marion County in 2024 (534 in 5+ unit buildings).
- Marion County population projected at +13% by 2050 — modest demand growth; plan on rents tracking national, not racing it.
- Cap rate 7.2% vs local median 4.5% in Liberty Triangle — top-decile yield for the area; either an underpriced asset or a hidden risk that comps aren't pricing in. Stress-test before assuming the spread holds.
- This rent runs 38% of the median local income ($66k/yr) — at the standard rent-burdened threshold; future hikes will face affordability resistance.
Questions for listing agent
- It's been on market 76 days. Have you received any prior offers? Is the seller open to a 6% concession, seller financing, or rate buy-down credit?
- Why hasn't it sold? Are there any deal-killer items the seller is aware of (foundation, flood, title, zoning, code violations)?
- Is there a deadline driving the sale (1031 exchange, divorce, estate, relocation)? That informs how much negotiation room exists.
- The area grade is low — what's the realistic commute time and amenity access for the typical tenant pool here? Any planned neighborhood developments (good or bad) we should know about?
- What's the average days-on-market for RENTAL listings here right now (not sales)? A rising rental-DOM trend means longer vacancies and softer asking-rent achievability than the comps imply.
- What's the recent tenant-quality profile in this submarket — average credit score on applications, eviction rate, late-payment / NSF rate, and stable-employment percentage? A property-management company in the area should have these aggregated.
- How much new for-sale + rental construction is in the pipeline within 1–3 miles? Heavy new supply typically softens prices + rents 12–24 months out; constrained supply supports both.
CashFlowRE · CFR-RHGFCPDK4FW338
· Data 13 h ago
cashflowre.app · 2026-05-29