 🏗️ New Construction
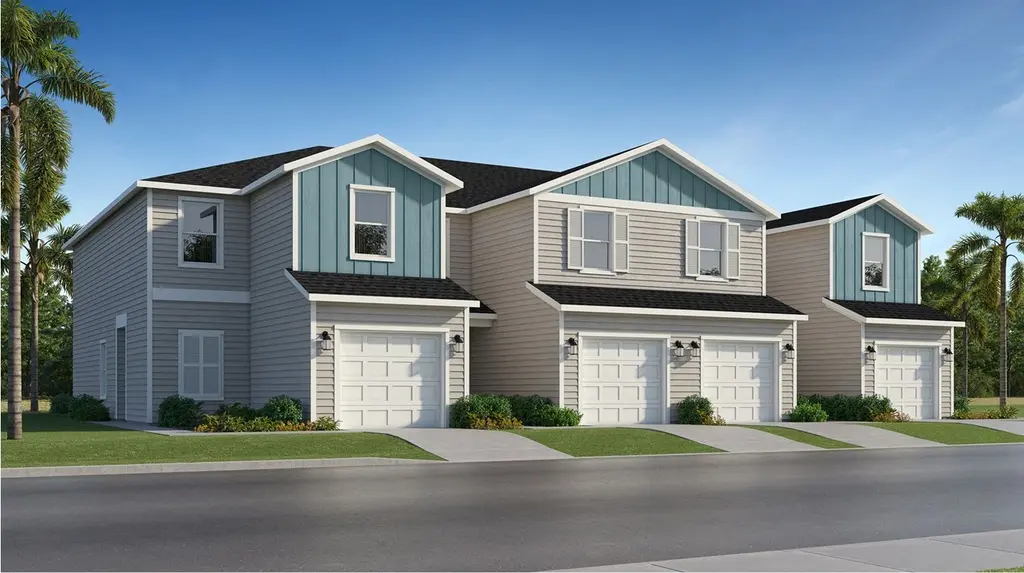
Irving Plan · Liberty Triangle, FL
Flood risk No data
- FEMA flood zone
- —
- Chance of flooding over 30 yrs
- —
- Est. flood insurance / yr
- —
Fire risk No data
- Est. fire insurance / yr
- —
Heat risk No data
- Hot days now (above threshold)
- —
- Hot days in 30 yrs
- —
Wind risk No data
- Chance of severe wind over 30 yrs
- —
Air-quality risk No data
- Unhealthy air days now
- —
- Unhealthy air days in 30 yrs
- —
Risk factors via First Street. Map © Google.
Why this score? — see what drove the D+ grade
The composite is a weighted blend of 9 inputs, each scored 0–100. Each bar is that input's sub-score; the figure is the points it added to the 100-point composite (weight × sub-score).
- Cash flow +17.6/30.0
- ARV discount +7.5/15.0
- DSCR +5.5/10.0
- 1% rule +4.8/10.0
- Condition / age +4.0/5.0
- Schools +3.6/10.0
- Livability +2.5/5.0
- Rent growth +1.9/5.0
- Appreciation +0.0/10.0
$217,990
🖨 Deal sheet (PDF) 📄 Offer letter ✓ Due diligence
Listing remarks MLS
Past the foyer of this new two-story townhome is a gracious layout connecting the living and dining spaces. It features a well-equipped kitchen and its center island, followed by an intimate dining room and a sprawling family room made for gatherings. On the top floor is a central loft for versatile needs, along with two secondary bedrooms and a tranquil owner's suite.
Key facts
- Central loft
- Intimate dining room
- Center island
Tags
Neighborhood map
What this means for you Summary
Snapshot
- This is a 3-bed/2.5-bath townhouse listed at $218k. Condition is rated good.
Deal economics
- At list price, monthly cash flow is $169 ($2k/yr) — positive.
- The deal already cash-flows at list — no discount required.
- To meet the 1% rule (rent ≥ 1% of price), the offer needs to be $208k (4.8% below list).
- Recommended offer: $205k (6.0% below list) — sets the bar for market timing.
- Cap rate 7.2% vs local median 4.5% in Liberty Triangle — top-decile yield for the area; either an underpriced asset or a hidden risk that comps aren't pricing in. Stress-test before assuming the spread holds.
Location & tenants
- Location reads: area grade D — affects rentability + tenant quality, not the cash-flow math above.
- Marion (rural): math 42% / reading 43% proficiency, ranked #61 of 73 in FL (top 84%) — families likely to look elsewhere, expect single-tenant / working-renter base with shorter leases; 61% free/reduced lunch — lower-income household profile, screen leases tightly.
- Zoned schools: Hammett Bowen Jr. Elementary School (math 56% / reading 56%, grade C+, #832 of 2,144 statewide, top 40%, 867 students, 54% FRL); Liberty Middle School (math 40% / reading 41%, grade F, #360 of 571 statewide, top 64%, 1,365 students, 54% FRL); West Port High School (math 34% / reading 52%, grade F, #255 of 667 statewide, top 39%, 2,906 students, 52% FRL).
- Market conditions: Rents soft (-2.6%/yr); 858 active listings in the ZIP; 24 comparable units currently listed for rent nearby; rentals at typical pace (median 16d on market — plan ~3-4 weeks tenant-placement turnaround); 7,071 units permitted in Marion County in 2024 (534 in 5+ unit buildings).
- This rent runs 38% of the median local income ($66k/yr) — at the standard rent-burdened threshold; future hikes will face affordability resistance.
Forward outlook
- Local home prices are declining (-3.0%/yr); year-one equity from $1k of loan paydown is wiped out by about $6k of value loss. Plan a longer hold.
- Marion County population projected at +13% by 2050 — modest demand growth; plan on rents tracking national, not racing it.
Negotiation context
- It's been on market 76 days — a 6% lower offer ($205k) is reasonable based on typical stale-listing flexibility.
Questions for the listing agent
- It's been on market 76 days. Have you received any prior offers? Is the seller open to a 6% concession, seller financing, or rate buy-down credit?
- Why hasn't it sold? Are there any deal-killer items the seller is aware of (foundation, flood, title, zoning, code violations)?
- Is there a deadline driving the sale (1031 exchange, divorce, estate, relocation)? That informs how much negotiation room exists.
- The area grade is low — what's the realistic commute time and amenity access for the typical tenant pool here? Any planned neighborhood developments (good or bad) we should know about?
- What's the average days-on-market for RENTAL listings here right now (not sales)? A rising rental-DOM trend means longer vacancies and softer asking-rent achievability than the comps imply.
- What's the recent tenant-quality profile in this submarket — average credit score on applications, eviction rate, late-payment / NSF rate, and stable-employment percentage? A property-management company in the area should have these aggregated.
- How much new for-sale + rental construction is in the pipeline within 1–3 miles? Heavy new supply typically softens prices + rents 12–24 months out; constrained supply supports both.
Investment metrics
- 1% rule
- 0.98% ✗
- Cap rate
- 7.25%
- Cash-on-cash
- 3.41%
- DSCR
- 1.15
- GRM
- 8.5
CMA / ARV
- ARV (median comp)
- $212,785
- List price
- $217,990
- Delta
- 2.45%
- Verdict
- FAIR
- Comps
- 3 within 1.0 mi
Show comp detail 3 sales within ~0.75 mi
| Address | Dist | Beds/Ba | Sqft | Sold | Price | $/sf | Match |
|---|---|---|---|---|---|---|---|
| 4883 SW 81st Loop | 0.08mi | 3/2.0 | 1,716 (-0%) | 7mo | $247,390 | $144 | 88 |
| 4879 SW 81st Loop | 0.08mi | 3/2.5 | 1,765 (+3%) | 6mo | $212,000 | $120 | 87 |
| 4942 SW 81st St | 0.46mi | 3/2.5 | 1,707 (-1%) | 11mo | $200,000 | $117 | 69 |
Match score weights: distance 35% · size 25% · config 20% · recency 20%. Top-matched comps best support the ARV.
Projected returns pro-forma
-3.0% appreciation · 0.0% rent growth · sell at horizon
- IRR
- -14.4%
- Equity multiple
- 0.50×
- Total profit
- $-29,752
- Equity at exit
- $31,727
- IRR
- -11.5%
- Equity multiple
- 0.41×
- Total profit
- $-35,408
- Equity at exit
- $18,398
Cash invested: $59,580 (down + closing). Projections, not guarantees.
Landlord ↔ Tenant lean methodology
- Overall (STATE)
- 87 Strongly Landlord-Friendly
- State Florida
- 87 Strongly Landlord-Friendly · R+3
- County
- — inherits STATE
- City
- — inherits STATE
ZIP-level market 34476
- Rents YoY
- -2.6%
- Active inventory
- 858
- Price-to-rent
- 8.8×
Monthly cashflow live
- Estimated rent
- $2,076 high interval (Pro) →
- Mortgage (P&I)
- −$1,116
- Tax est. 1.5%
- −$266 /mo · $3,192/yr
- Insurance
- −$89
- HOA
- −$0
- Vacancy / Maint / Mgmt
- −$436
- Net cashflow
- $169
Break-even live
Sensitivity live
| Price | -10% $316 | -5% $243 | +0% $169 | +5% $96 | +10% $22 |
|---|---|---|---|---|---|
| Rent | -10% $5 | -5% $87 | +0% $169 | +5% $251 | +10% $333 |
| Rate | -1.0pp $276 | -0.5pp $223 | base $169 | +0.5pp $114 | +1.0pp $58 |
UW: 25.0% down · 7.5% · 30yr · 1.5% tax · 5.0% vac · 8.0% maint · 8.0% mgmt
Financing live
Cash to close
- Down payment
- $53,196
- Closing costs
- $6,384
- Reserves months
- —
- Total cash needed
- —
Loan-product check · same deal, 3 products live
Conventional
25% down · 7.5% · 30yr
- Down + closing
- —
- Monthly P&I
- —
- Monthly cashflow
- —
- DSCR
- —
- Eligible?
- —
Personal DTI + credit; lowest rate.
DSCR
20% down · 8.5% · 30yr
- Down + closing
- —
- Monthly P&I
- —
- Monthly cashflow
- —
- DSCR
- —
- Eligible?
- —
No personal income docs; deal must DSCR.
Hard money
10% down · 12.0% · 12mo
- Down + closing
- —
- Monthly P&I
- —
- Monthly cashflow
- —
- DSCR
- —
- Eligible?
- —
Short-term bridge; refi at stabilization.
Rent comps 24 comps
| Address | Beds | Baths | Sqft | Rent | $/sqft | DOM | Units | Dist |
|---|---|---|---|---|---|---|---|---|
| 4939 SW 81st Loop Ocala, FL | 3.0 | 2.5 | 1828 | $1,750 | $0.96 | 15d | 1 | 0.01mi |
| 4915 SW 81st St Ocala, FL | 3.0 | 2.5 | 1707 | $1,795 | $1.05 | 15d | 1 | 0.05mi |
| 4643 SW 84th Street Rd Ocala, FL | 3.0 | 2.0 | 1663 | $1,925 | $1.16 | 15d | 1 | 0.23mi |
| 4703 SW 85th Pl Ocala, FL | 4.0 | 2.0 | 1828 | $2,500 | $1.37 | 15d | 1 | 0.31mi |
| 8609 SW 46th Ter Ocala, FL | 3.0 | 2.0 | 1670 | $2,400 | $1.44 | 15d | 1 | 0.41mi |
| 8590 SW 44th Ct Ocala, FL | 3.0 | 2.0 | 1453 | $1,895 | $1.30 | 15d | 1 | 0.47mi |
| 8590 SW 44th Ct Ocala, FL | 3.0 | 2.0 | 1453 | $1,895 | $1.30 | 15d | 1 | 0.47mi |
| 4828 SW 86th Ln Ocala, FL | 3.0 | 2.0 | 1672 | $1,950 | $1.17 | 23d | 1 | 0.48mi |
| 8602 SW 43rd Ter Ocala, FL | 4.0 | 2.5 | 2176 | $2,195 | $1.01 | 15d | 1 | 0.52mi |
| 8602 SW 43rd Ter Ocala, FL | 4.0 | 2.5 | 2176 | $2,195 | $1.01 | 15d | 1 | 0.52mi |
| 8665 SW 44th Ct Ocala, FL | 3.0 | 2.0 | 1453 | $1,895 | $1.30 | 23d | 1 | 0.55mi |
| 8704 SW 44th Ct Ocala, FL | 4.0 | 2.5 | 2176 | $2,195 | $1.01 | 23d | 1 | 0.57mi |
| 8704 SW 44th Ct Ocala, FL | 4.0 | 2.5 | 2176 | $2,195 | $1.01 | 15d | 1 | 0.57mi |
| 8320 SW 41st Ter Ocala, FL | 3.0 | 2.0 | 1841 | $2,300 | $1.25 | 15d | 1 | 0.63mi |
| 8780 SW 49th Cir Ocala, FL | 3.0 | 2.0 | 1672 | $1,900 | $1.14 | 23d | 1 | 0.66mi |
| 4697 SW 89th St Ocala, FL | 4.0 | 2.0 | 1848 | $2,150 | $1.16 | 15d | 1 | 0.67mi |
| 8792 SW 49th Cir Ocala, FL | 4.0 | 2.0 | 1498 | $1,850 | $1.23 | 23d | 1 | 0.69mi |
| 8940 SW 50th Ter Ocala, FL | 4.0 | 2.0 | 1827 | $2,195 | $1.20 | 23d | 1 | 0.74mi |
| 9109 SW 45th Ter Ocala, FL | 4.0 | 2.0 | 1828 | $2,150 | $1.18 | 15d | 1 | 0.90mi |
| 7177 SW 92nd St Ocala, FL | 3.0 | 2.5 | 1410 | $1,850 | $1.31 | 23d | 1 | 0.96mi |
| 13110 SW 89th St Ocala, FL | 4.0 | 2.5 | 1824 | $1,950 | $1.07 | 23d | 1 | 1.22mi |
| 5637 SW 93rd St Ocala, FL | 4.0 | 3.0 | 2039 | $2,600 | $1.28 | 15d | 1 | 1.29mi |
| 4780 SW 95th Ln Ocala, FL | 4.0 | 3.0 | 2002 | $2,395 | $1.20 | 15d | 1 | 1.36mi |
| 9324 SW 58th Cir Ocala, FL | 3.0 | 2.0 | 2141 | $2,500 | $1.17 | 23d | 1 | 1.39mi |
Listing history 17 events
-
2026-06-22days on market $217,990 Active 76 DOM
-
2026-06-18days on market $217,990 Active 73 DOM
-
2026-06-17days on market $217,990 Active 72 DOM
-
2026-06-16days on market $217,990 Active 71 DOM
-
2026-06-15days on market $217,990 Active 70 DOM
-
2026-06-14days on market $217,990 Active 68 DOM
-
2026-06-13days on market $217,990 Active 67 DOM
-
2026-06-10days on market $217,990 Active 65 DOM
-
2026-06-09days on market $217,990 Active 64 DOM
-
2026-06-08days on market $217,990 Active 63 DOM
-
2026-06-07days on market $217,990 Active 62 DOM
-
2026-06-03days on market $217,990 Active 58 DOM
-
2026-06-02days on market $217,990 Active 57 DOM
-
2026-05-31days on market $217,990 Active 55 DOM
-
2026-05-30days on market $217,990 Active 54 DOM
-
2026-05-12price $217,990 371-char remark
Show marketing remark (371 chars)
Past the foyer of this new two-story townhome is a gracious layout connecting the living and dining spaces. It features a well-equipped kitchen and its center island, followed by an intimate dining room and a sprawling family room made for gatherings. On the top floor is a central loft for versatile needs, along with two secondary bedrooms and a tranquil owner's suite.
-
2026-04-06$222,990 Active 371-char remark
Show marketing remark (371 chars)
Past the foyer of this new two-story townhome is a gracious layout connecting the living and dining spaces. It features a well-equipped kitchen and its center island, followed by an intimate dining room and a sprawling family room made for gatherings. On the top floor is a central loft for versatile needs, along with two secondary bedrooms and a tranquil owner's suite.
ⓘ Source: listings_history table (triggers on properties + properties_extension) + one-shot
backfill from property_details.listing_events for pre-trigger history.
Nearby sold comps map
Loading sold comps map…
Walkable amenities ~0.75 mi
Loading nearby amenities…
Taxation est. · year 1
- Rental income
- $24,908
- − Mortgage interest
- −$11,919
- − Property taxes
- −$3,192
- − Insurance
- −$1,064
- − Repairs & maintenance
- −$1,993
- − Management
- −$1,993
- − Depreciation
- −$6,190
- Taxable loss
- −$1,443
- Est. tax savings @ 24.0%
- +$346
- After-tax cash flow
- $2,377/yr
For passive investors: Depreciation is non-cash, so a rental often shows a tax loss while cash-flowing — sheltering income. Rental losses are passive: they offset passive income freely, and up to $25,000/yr can offset ordinary (W-2) income if you actively participate and your MAGI is under $100k (phasing out to $0 by $150k); unused losses carry forward. On sale, claimed depreciation is recaptured at up to 25%, and gains may owe capital-gains tax (a 1031 exchange can defer both). Figures are a year-1 estimate at your 24.0% rate — not tax advice; consult a CPA.
Condition & rehab AI · 12 photos
This modern townhome is in excellent condition with a good condition score of 80. It has a neutral color palette and a well-maintained exterior. The interior is spacious and features modern appliances and fixtures. The property has potential for further value increases with minor updates.
Value-add opportunities
- Both Paint the exterior siding — Enhances curb appeal and property value
- Both Replace carpet with hardwood flooring — Improves aesthetics and increases value
- Both Install smart home technology — Enhances convenience and adds modern appeal
Renovation cost estimate screening
Value-add ROI direction
- Both Paint the exterior siding — Enhances curb appeal and property value ↑
- Both Replace carpet with hardwood flooring — Improves aesthetics and increases value ↑
- Both Install smart home technology — Enhances convenience and adds modern appeal ↑
ⓘ Cost ranges are severity-bucket heuristics (US national rule-of-thumb). Get contractor quotes + a written scope before underwriting a rehab budget.
Schools (NCES district)
- District
- Marion
- NCES district ID
- 1201260
- Math proficiency
- 42% ▼ -7.00%
- Reading proficiency
- 43% ▼ -4.00%
- Median HH income
- $40,015
- Composite
- 35.61/100
- National rank
- #4890
- State rank
- #61 of 73 in FL
Livability — Liberty Triangle
No livability data for this city. (Only ~50 U.S. cities are tracked.)
Census & demographics
- Census place
- Liberty Triangle, FL
- County
- Marion County · 315,796 people
- City population
- 26,397
- Metro
- Ocala, FL
- Population (ZIP)
- 28,997
- Household income
- $65,860
- Rent vs Own
- Severe rent burden
- 204.0
Population outlook (Marion County) Hauer SSP2
- Today (2025)
- 365,905 people
- By 2030
- 376,768 · +3.0%
- By 2040
- 396,555 · +8.4%
- By 2050
- 412,723 · +12.8%
- By 2075
- 446,090 · +21.9%
- By 2100
- 436,193 · +19.2%
Race, ethnicity, and origin ACS 2023
- Neighborhood character
- Diverse neighborhood (Simpson 0.55)
- Race & ethnicity
- White 63% Hispanic / Latino 18% Black 13% Two or more races 10% Asian 1%
- Hispanic origin (detail)
- Mexican 3% Puerto Rican 8% Cuban 3%
- Common ancestry
- Romanian 3% Slovak 3% Lithuanian 3%
- Foreign-born
- 15% · Canada, Jamaica, Dominican Republic
- Languages at home
- 83% English-only · Spanish 14% Other Indo-European 1% German/W. Germanic 1%
Political lean MEDSL · Marion
- 2024 margin
- Solid R (+31.6) · D 33.8% · R 65.5%
- 2008→2024 swing
- -20.0pp toward R · 2008: -11.6pp · 2024: -31.6pp
- All cycles
- 2024: R+31.6 2020: R+25.9 2016: R+26.2 2012: R+16.2 2008: R+11.6
Not yet ingested
- Civics
- —
Market trends
- HPI YoY
- ▼ -105.22%
- Current HPI
- 189.0869
- Rent YoY
- ▼ -2.57%
- Metro
- Ocala, FL
- State GDP YoY
- ▲ 3.28%
- F500 in state
- 36
Industry mix (Fortune 500 HQ in FL)
| Industry | F500 HQs | Revenue |
|---|---|---|
| Industrial Technology | 2 | $29B |
|
||
| Insurance | 2 | $17B |
|
||
| Retail | 1 | $60B |
|
||
| Technology Distribution | 1 | $58B |
|
||
| Homebuilding | 1 | $35B |
|
||
| Technology Manufacturing | 1 | $35B |
|
||
Price history
-2.2% since first listed2 events — show timeline
- 2026-05-12 Price Changed $217,990 Zillow
- 2026-04-06 Listed $222,990 Zillow
Cash-flow waterfall
monthlySold comps — $/sqft
last 12 mo · ≤1 miLoading sold comps…