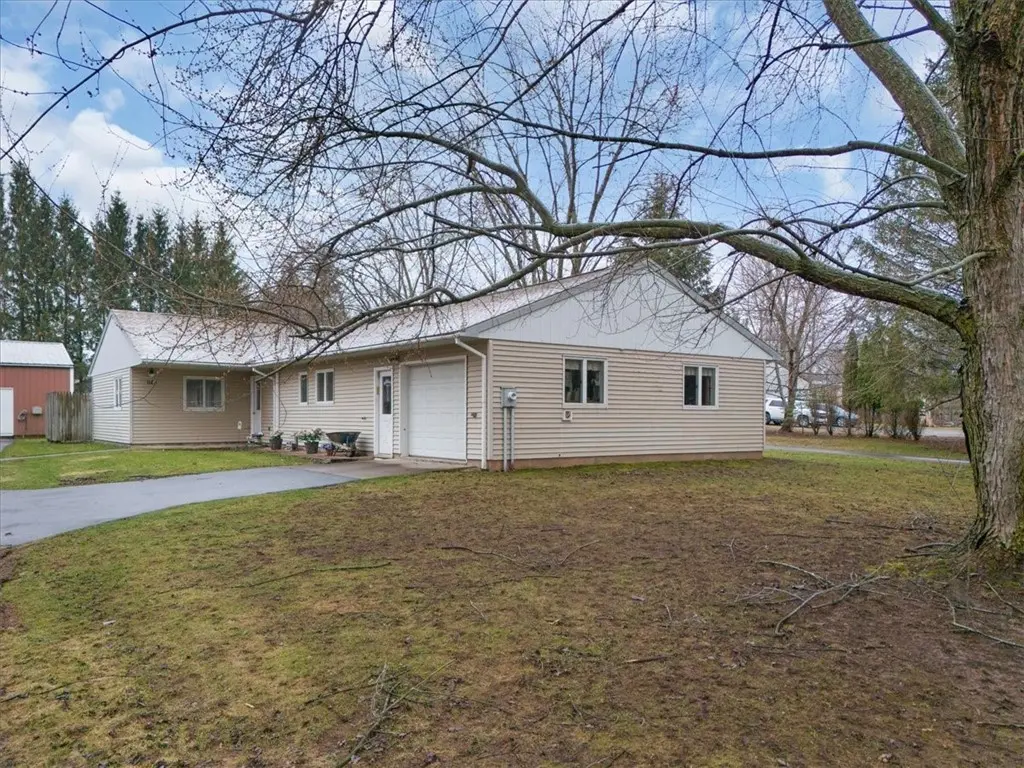
1740 Kenyon Rd
Ontario, NY 14519
$194,500C-
3 bd · 1.5 ba ·
1,664 sqft ·
Built 1985
· SingleFamily
· Pending
· 8 DOM
Cashflow @ list (25.0% down · 7.5%)
Estimated rent
$1,992/mo
Mortgage (P&I)
−$1,020
Tax + insurance
−$574
HOA
−$0
Vac / Maint / Mgmt
−$418
Net cashflow
$-21/mo
Annual
$-246/yr
Cap rate
6.17%
Cash-on-cash
-0.45%
DSCR
0.98
1% rule
1.02%
Cash to close
$54,460
Investor read
- This is a 3-bed/1.5-bath single-family listed at $194k.
- At list price, monthly cash flow is $-21 ($-246/yr) — negative.
- To cash-flow at today's rent, offer at most $191k (1.9% below list).
- Meets the 1% rule at list price ($2k rent vs $194k).
- Only 8 days on market — expect competitive offers; lowballing is unlikely to land.
- Recommended offer: $191k (1.9% below list) — sets the bar for cash-flow.
- Local home prices are declining (-3.0%/yr); year-one equity from $1k of loan paydown is wiped out by about $6k of value loss. Plan a longer hold.
- Location reads 71/100 on livability (#385 in NY) — a middle-class / working-renter tenant base. Strengths: housing A+, crime A-, cost of living B+; Watch: commute D, amenities F, health & safety D-.
- Wayne Central School District (suburban): math 57% / reading 68% proficiency, ranked #194 of 590 in NY (top 33%) — acceptable for families but not a draw, mixed tenant base, ~2y average lease.
- Zoned schools: Wayne Central Primary School (439 students, 38% FRL); Wayne Central Middle School (math 42% / reading 59%, grade C, #259 of 729 statewide, top 36%, 625 students, 39% FRL); Wayne Senior High School (math 92% / reading 98%, grade A+, #93 of 1,100 statewide, top 10%, 670 students, 37% FRL) — zoned schools average 38% FRL vs 22% district-wide (16 pts higher); higher-poverty schools than district average — tighter screening recommended.
- Watch-outs: property tax is 3.0% of price.
- Market conditions: 87 active listings in the ZIP; 5 comparable units currently listed for rent nearby; rentals at typical pace (median 26d on market — plan ~3-4 weeks tenant-placement turnaround); 40% of comp listings sitting > 30 days — soft ceiling on asking rent; 259 units permitted in Wayne County in 2024 (90 in 5+ unit buildings).
- Wayne County population projected at -24% by 2050 — secular population decline; favor cash flow + early exit over multi-decade hold.
- Cap rate 6.2% vs local median 3.3% in Ontario — top-decile yield for the area; either an underpriced asset or a hidden risk that comps aren't pricing in. Stress-test before assuming the spread holds.
Questions for listing agent
- What do current leases actually rent for vs. the listed asking? Can we see a recent rent roll and the last 12 months of T-12 income?
- Property tax is high relative to price — has the assessment been appealed recently, and will the sale trigger a re-assessment?
- Is there a deadline driving the sale (1031 exchange, divorce, estate, relocation)? That informs how much negotiation room exists.
- What's the average days-on-market for RENTAL listings here right now (not sales)? A rising rental-DOM trend means longer vacancies and softer asking-rent achievability than the comps imply.
- What's the recent tenant-quality profile in this submarket — average credit score on applications, eviction rate, late-payment / NSF rate, and stable-employment percentage? A property-management company in the area should have these aggregated.
- How much new for-sale + rental construction is in the pipeline within 1–3 miles? Heavy new supply typically softens prices + rents 12–24 months out; constrained supply supports both.
CashFlowRE · CFR-RJ5S3A97TEZB78
· Data 4 weeks ago
cashflowre.app · 2026-05-29