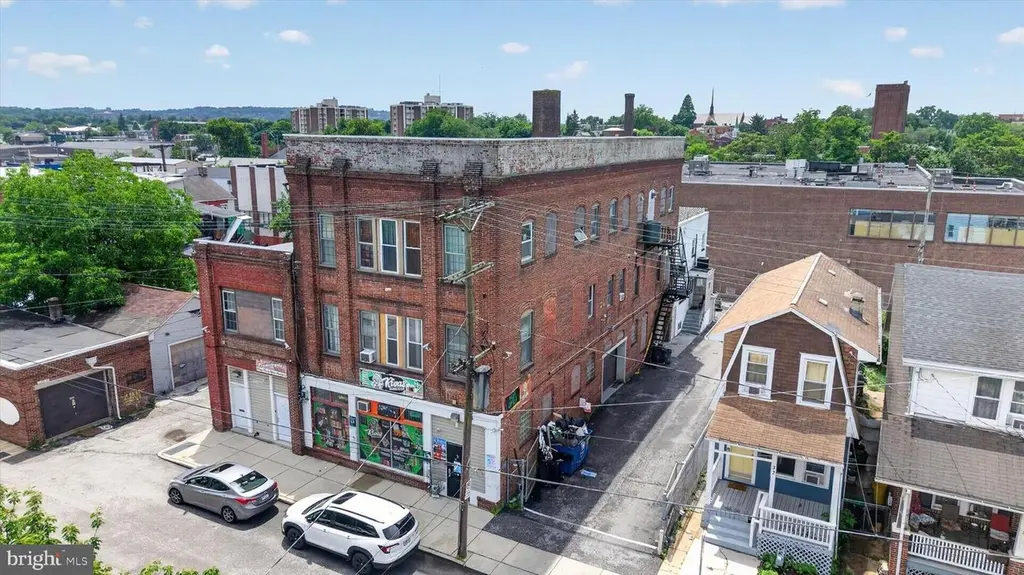
22 N State St
York, PA 17403
$799,000D-
12 bd · 0.0 ba ·
3,480 sqft ·
Built 1910
· MultiFamily
· Active
· 20 DOM
Cashflow @ list (25.0% down · 7.5%)
Estimated rent
$6,088/mo
Mortgage (P&I)
−$4,190
Tax + insurance
−$530
HOA
−$0
Vac / Maint / Mgmt
−$1,278
Net cashflow
$89/mo
Annual
$1,069/yr
Cap rate
6.43%
Cash-on-cash
0.48%
DSCR
1.02
1% rule
0.76%
Cash to close
$223,720
Investor read
- This is a 6 × 2-bed/?-bath units multifamily listed at $799k.
- At list price, monthly cash flow is $89 ($1k/yr) — positive. Per door: $15/mo.
- The deal already cash-flows at list — no discount required.
- To meet the 1% rule (rent ≥ 1% of price), the offer needs to be $609k (23.8% below list).
- It's been on market 20 days — a 2% lower offer ($787k) is reasonable based on typical stale-listing flexibility.
- Recommended offer: $609k (23.8% below list) — sets the bar for 1% rule.
- Local home prices are declining (-3.0%/yr); year-one equity from $6k of loan paydown is wiped out by about $24k of value loss. Plan a longer hold.
- Location reads 75/100 on livability (#427 in PA, #3,987 nationally) — a middle-class / working-renter tenant base. Strengths: cost of living A+, health & safety A+, housing A; Watch: amenities D+, crime F, employment F.
- York City SD (urban): math 4% / reading 16% proficiency, ranked #534 of 539 in PA (top 99%) — low school quality limits family demand, transient renter base, plan for 1-2y turnover; 72% free/reduced lunch — lower-income household profile, screen leases tightly.
- Watch-outs: built in 1910 — expect roof / HVAC / electrical / plumbing capex.
- Market conditions: Rents rising fast (+4.4%/yr); 213 active listings in the ZIP; solid renter incomes; 1,328 units permitted in York County in 2024 (338 in 5+ unit buildings).
- 2 sale attempts since 2y ago with the ask held roughly flat each time — persistent listings suggest the price (not the market) is what's stuck; bring a comps-based counter.
- Current owner paid $5k; list at $799k implies a 15880% gain — meaningful room to come down on a strong offer.
- Cap rate 6.4% vs local median 5.0% in York — meaningfully above typical; check what's discounted (condition, days-on-market, listing class) to confirm the premium yield is real.
- At $6,088/mo this rent would consume 97% of the median local household income ($75k/yr) (locally 1305% of renters already pay >50% of income on rent) — very limited rent-growth headroom before tenants either downsize or default.
Questions for listing agent
- Can we see the unit-by-unit rent roll, current vacancy, and any below-market leases? What's the average tenancy length?
- What capital expenditures (roof, boiler, parking lot, exteriors) have been made in the last 5 years, and what's planned in the next 2?
- Built in 1910 — when were the roof, HVAC, electrical panel, plumbing, and water heater last replaced?
- Is there a deadline driving the sale (1031 exchange, divorce, estate, relocation)? That informs how much negotiation room exists.
- Crime grade is F in this area — have there been break-ins, vandalism, or insurance claims at this property in the last 3 years? What carrier currently insures it and at what premium?
- The area grade is low — what's the realistic commute time and amenity access for the typical tenant pool here? Any planned neighborhood developments (good or bad) we should know about?
- What's the average days-on-market for RENTAL listings here right now (not sales)? A rising rental-DOM trend means longer vacancies and softer asking-rent achievability than the comps imply.
- What's the recent tenant-quality profile in this submarket — average credit score on applications, eviction rate, late-payment / NSF rate, and stable-employment percentage? A property-management company in the area should have these aggregated.
CashFlowRE · CFR-RJEPVXEWKTZXMS
· Data 3 days ago
cashflowre.app · 2026-05-29