 6-Plex
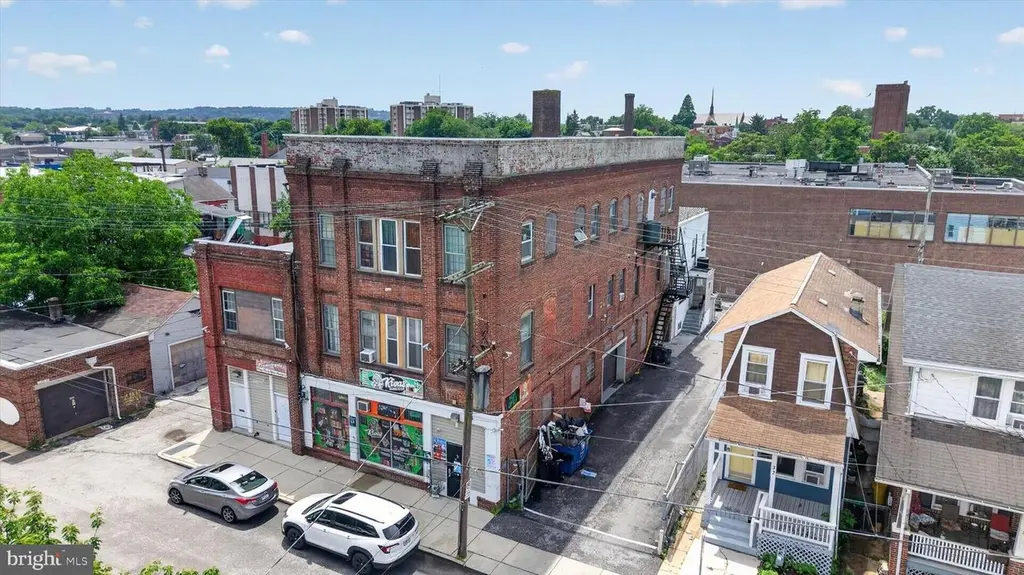
22 N State St · York, PA
Flood risk No data
- FEMA flood zone
- —
- Chance of flooding over 30 yrs
- —
- Est. flood insurance / yr
- —
Fire risk No data
- Est. fire insurance / yr
- —
Heat risk No data
- Hot days now (above threshold)
- —
- Hot days in 30 yrs
- —
Wind risk No data
- Chance of severe wind over 30 yrs
- —
Air-quality risk No data
- Unhealthy air days now
- —
- Unhealthy air days in 30 yrs
- —
Risk factors via First Street. Map © Google.
Why this score? — see what drove the D- grade
The composite is a weighted blend of 9 inputs, each scored 0–100. Each bar is that input's sub-score; the figure is the points it added to the 100-point composite (weight × sub-score).
- Cash flow +13.9/30.0
- ARV discount +7.5/15.0
- DSCR +4.2/10.0
- Livability +3.8/5.0
- Rent growth +3.6/5.0
- 1% rule +2.6/10.0
- Condition / age +2.5/5.0
- Schools +0.8/10.0
- Appreciation +0.0/10.0
$799,000
🖨 Deal sheet 📄 Offer letter ✓ Due diligence
Multi-family units
County records classify this as Multi-Family (5+ Unit). Listing-text estimate: 6 units. confirmed
5+ unit building — per-unit beds/baths from public records are typically unavailable; the breakdown below (if shown) is an estimate from the listing text.
Listing remarks
Outstanding income-producing mixed-use 6-unit investment package in York City offering scale, parking, strong income, and upside! This four-parcel sale includes 22 N State Street, 26 N State Street, 527 E Market Rear Street, and 529 E Market Rear Street, featuring multiple residential and a commercial rental space, 14 off-street parking spaces, and a 9.5%+ cap rate. The units are very spacious with impressively high ceilings, giving the property a grand feel and making the rental spaces especially attractive to tenants. All units are currently rented except for one residential unit, allowing the next owner to step into immediate cash flow with additional upside once fully occupied. With ove
Key facts
- Off street parking
- Mixed use
- Residential unit
Tags
Property features AI
Finance
- Other: Building contains 4 total units; 1 vacant unit; 3 month-to-month units
- Financial info: Not specified
- HOA & community: Ground rent paid annually
Exterior
- Parking: Paved private parking lot with 14 spaces
- Security: Not specified
- Utilities: Public water; Public sewer
- Home design: Detached property; 3 total levels; Fee simple ownership
- Construction: Brick construction; Stone and other foundation; Rubber roof; Above-grade and below-grade other structures; Estimated year built
- Exterior features: Additional lot(s); No tidal water
Interior
- Kitchen: Not specified
- Bedrooms: One studio/single-room unit; One 2-bedroom unit; Four 3-bedroom units
- Flooring: Not specified
- Bathrooms: Not specified
- Heating & cooling: Forced air heating; Electric baseboard heating; Central air; Window A/C units; Cooling powered by electricity; Hot water: other
- Interior features: Estimated living area; 2+ access exits
- Laundry & utility: Not specified
Neighborhood map
What this means for you Summary
Snapshot
- This is a 6 × 2-bed/?-bath units multifamily listed at $799k.
Deal economics
- At list price, monthly cash flow is $89 ($1k/yr) — positive. Per door: $15/mo.
- The deal already cash-flows at list — no discount required.
- To meet the 1% rule (rent ≥ 1% of price), the offer needs to be $609k (23.8% below list).
- Recommended offer: $609k (23.8% below list) — sets the bar for 1% rule.
- Cap rate 6.4% vs local median 5.0% in York — meaningfully above typical; check what's discounted (condition, days-on-market, listing class) to confirm the premium yield is real.
Location & tenants
- Location reads 75/100 on livability (#427 in PA, #3,987 nationally) — a middle-class / working-renter tenant base. Strengths: cost of living A+, health & safety A+, housing A; Watch: amenities D+, crime F, employment F.
- York City SD (urban): math 4% / reading 16% proficiency, ranked #534 of 539 in PA (top 99%) — low school quality limits family demand, transient renter base, plan for 1-2y turnover; 72% free/reduced lunch — lower-income household profile, screen leases tightly.
- Market conditions: Rents rising fast (+4.4%/yr); 213 active listings in the ZIP; solid renter incomes; 1,328 units permitted in York County in 2024 (338 in 5+ unit buildings).
- At $6,088/mo this rent would consume 97% of the median local household income ($75k/yr) (locally 1305% of renters already pay >50% of income on rent) — very limited rent-growth headroom before tenants either downsize or default.
Forward outlook
- Local home prices are declining (-3.0%/yr); year-one equity from $6k of loan paydown is wiped out by about $24k of value loss. Plan a longer hold.
Negotiation context
- It's been on market 20 days — a 2% lower offer ($787k) is reasonable based on typical stale-listing flexibility.
- 2 sale attempts since 2y ago with the ask held roughly flat each time — persistent listings suggest the price (not the market) is what's stuck; bring a comps-based counter.
- Current owner paid $5k; list at $799k implies a 15880% gain — meaningful room to come down on a strong offer.
Risks & watch-outs
- Watch-outs: built in 1910 — expect roof / HVAC / electrical / plumbing capex.
Questions for the listing agent
- Can we see the unit-by-unit rent roll, current vacancy, and any below-market leases? What's the average tenancy length?
- What capital expenditures (roof, boiler, parking lot, exteriors) have been made in the last 5 years, and what's planned in the next 2?
- Built in 1910 — when were the roof, HVAC, electrical panel, plumbing, and water heater last replaced?
- Is there a deadline driving the sale (1031 exchange, divorce, estate, relocation)? That informs how much negotiation room exists.
- Crime grade is F in this area — have there been break-ins, vandalism, or insurance claims at this property in the last 3 years? What carrier currently insures it and at what premium?
- The area grade is low — what's the realistic commute time and amenity access for the typical tenant pool here? Any planned neighborhood developments (good or bad) we should know about?
- What's the average days-on-market for RENTAL listings here right now (not sales)? A rising rental-DOM trend means longer vacancies and softer asking-rent achievability than the comps imply.
- What's the recent tenant-quality profile in this submarket — average credit score on applications, eviction rate, late-payment / NSF rate, and stable-employment percentage? A property-management company in the area should have these aggregated.
- How much new apartment / multifamily construction is in the pipeline within 1–3 miles? Heavy new supply (>2% of stock underway) typically softens rents 12–24 months out; light construction supports rent growth.
Investment metrics
- 1% rule
- 0.76% ✗
- Cap rate
- 6.43%
- Cash-on-cash
- 0.48%
- DSCR
- 1.02
- GRM
- 10.9
CMA / ARV
No comps found within radius.
Projected returns pro-forma
-3.0% appreciation · 4.43% rent growth · sell at horizon
- IRR
- -14.2%
- Equity multiple
- 0.48×
- Total profit
- $-115,313
- Equity at exit
- $119,133
- IRR
- -3.7%
- Equity multiple
- 0.74×
- Total profit
- $-57,196
- Equity at exit
- $69,083
Cash invested: $223,720 (down + closing). Projections, not guarantees.
Landlord ↔ Tenant lean methodology
- Overall (STATE)
- 62 Landlord-Friendly
- State Pennsylvania
- 62 Landlord-Friendly · EVEN
- County
- — inherits STATE
- City
- — inherits STATE
ZIP-level market 17403
- Home prices YoY
- -26.9%
- Rents YoY
- 4.4%
- Active inventory
- 213
- Price-to-rent
- 65.6×
Monthly cashflow live
- Estimated rent
- $6,088 high interval (Pro) →
- Mortgage (P&I)
- −$4,190
- Tax from tax record
- −$197 /mo · $2,369/yr
- Insurance
- −$333
- HOA
- −$0
- Vacancy / Maint / Mgmt
- −$1,278
- Net cashflow
- $89
Break-even live
6-unit breakdown (identical units grouped — click to expand)
| Units | Beds | Baths | Est. rent |
|---|---|---|---|
| 6× units | 2 | — | $6,090 |
| #1 | 2 | — | $1,015 |
| #2 | 2 | — | $1,015 |
| #3 | 2 | — | $1,015 |
| #4 | 2 | — | $1,015 |
| #5 | 2 | — | $1,015 |
| #6 | 2 | — | $1,015 |
| Total (6 units) | $6,088 | ||
UW: 25.0% down · 7.5% · 30yr · 1.5% tax · 5.0% vac · 8.0% maint · 8.0% mgmt
Financing live
Cash to close
- Down payment
- $199,750
- Closing costs
- $23,970
- Reserves months
- —
- Total cash needed
- —
Loan-product check · same deal, 3 products live
Conventional
25% down · 7.5% · 30yr
- Down + closing
- —
- Monthly P&I
- —
- Monthly cashflow
- —
- DSCR
- —
- Eligible?
- —
Personal DTI + credit; lowest rate.
DSCR
20% down · 8.5% · 30yr
- Down + closing
- —
- Monthly P&I
- —
- Monthly cashflow
- —
- DSCR
- —
- Eligible?
- —
No personal income docs; deal must DSCR.
Hard money
10% down · 12.0% · 12mo
- Down + closing
- —
- Monthly P&I
- —
- Monthly cashflow
- —
- DSCR
- —
- Eligible?
- —
Short-term bridge; refi at stabilization.
Listing history 16 events
-
2026-06-18days on market $799,000 Active 20 DOM
-
2026-06-17days on market $799,000 Active 19 DOM
-
2026-06-16days on market $799,000 Active 18 DOM
-
2026-06-15days on market $799,000 Active 17 DOM
-
2026-06-14days on market $799,000 Active 15 DOM
-
2026-06-13days on market $799,000 Active 14 DOM
-
2026-06-10days on market $799,000 Active 12 DOM
-
2026-06-09days on market $799,000 Active 11 DOM
-
2026-06-08days on market $799,000 Active 10 DOM
-
2026-06-07days on market $799,000 Active 9 DOM
-
2026-06-03days on market $799,000 Active 5 DOM
-
2026-06-02days on market $799,000 Active 4 DOM
-
2026-06-01days on market $799,000 Active 3 DOM
-
2026-05-31days on market $799,000 Active 2 DOM
-
2026-05-30remarks 699-char remark
-
2026-05-30$799,000 Active 1 DOM
ⓘ Source: listings_history table (triggers on properties + properties_extension) + one-shot
backfill from property_details.listing_events for pre-trigger history.
Tax reassessment forecast PA · Partial reset (capped growth)
- Current annual tax
- $2,369 · $197/mo
- Projected year-2 tax
- $7,497 · $625/mo
- Expected delta
- +$5,127/yr (+$427/mo · 216.4%)
ⓘ Screening estimate from a state-policy table — verify with the county assessor before closing.
Nearby sold comps map
Loading sold comps map…
Walkable amenities ~0.75 mi
Loading nearby amenities…
Taxation est. · year 1
- Rental income
- $73,056
- − Mortgage interest
- −$44,756
- − Property taxes
- −$2,369
- − Insurance
- −$3,995
- − Repairs & maintenance
- −$5,844
- − Management
- −$5,844
- − Depreciation
- −$23,244
- Taxable loss
- −$12,997
- Est. tax savings @ 24.0%
- +$3,119
- After-tax cash flow
- $4,189/yr
For passive investors: Depreciation is non-cash, so a rental often shows a tax loss while cash-flowing — sheltering income. Rental losses are passive: they offset passive income freely, and up to $25,000/yr can offset ordinary (W-2) income if you actively participate and your MAGI is under $100k (phasing out to $0 by $150k); unused losses carry forward. On sale, claimed depreciation is recaptured at up to 25%, and gains may owe capital-gains tax (a 1031 exchange can defer both). Figures are a year-1 estimate at your 24.0% rate — not tax advice; consult a CPA.
Schools (NCES district)
- District
- York City SD
- NCES district ID
- 4226820
- Math proficiency
- 4% ▼ -7.00%
- Reading proficiency
- 16% ▼ -9.00%
- Median HH income
- $29,470
- Composite
- 7.61/100
- National rank
- #9943
- State rank
- #534 of 539 in PA
Livability — York
- Score
- 75/100
- State rank
- #427
- US rank
- #3987
Category grades
Schools grade is shown separately in the Schools card above.
Census & demographics
- Census place
- York, PA
- County
- York County · 278,806 people
- City population
- 184,764
- Metro
- York-Hanover, PA
- Population (ZIP)
- 40,287
- Household income
- $75,384
- Rent vs Own
- Severe rent burden
- 1305.0
Population outlook (York County) Hauer SSP2
- Today (2025)
- 454,205 people
- By 2030
- 457,407 · +0.7%
- By 2040
- 457,529 · +0.7%
- By 2050
- 448,261 · -1.3%
- By 2075
- 427,388 · -5.9%
- By 2100
- 384,218 · -15.4%
Race, ethnicity, and origin ACS 2023
- Neighborhood character
- Diverse neighborhood (Simpson 0.58)
- Race & ethnicity
- White 60% Hispanic / Latino 20% Black 12% Two or more races 9% Asian 3%
- Hispanic origin (detail)
- Mexican 3% Puerto Rican 10% Dominican 3%
- Common ancestry
- Romanian 3% Lithuanian 1% Slovak 1%
- Foreign-born
- 10% · Canada, Vietnam, Jamaica
- Languages at home
- 81% English-only · Spanish 14% Other Indo-European 1% Arabic 1%
Political lean MEDSL · York
- 2024 margin
- Strong R (+25.3) · D 36.9% · R 62.1%
- 2008→2024 swing
- -11.7pp toward R · 2008: -13.6pp · 2024: -25.3pp
- All cycles
- 2024: R+25.3 2020: R+24.6 2016: R+29.3 2012: R+21.2 2008: R+13.6
Not yet ingested
- Civics
- —
Market trends
- HPI YoY
- ▼ -104.51%
- Current HPI
- 284.0731
- Rent YoY
- ▲ 4.43%
- Metro
- York-Hanover, PA
- State GDP YoY
- ▲ 1.68%
- F500 in state
- 34
Industry mix (Fortune 500 HQ in PA)
| Industry | F500 HQs | Revenue |
|---|---|---|
| Healthcare | 2 | $309B |
|
||
| Insurance | 2 | $27B |
|
||
| Telecommunications / Media | 1 | $124B |
|
||
| Industrial Distribution | 1 | $22B |
|
||
| Financial Services | 1 | $20B |
|
||
| Chemicals / Materials | 1 | $18B |
|
||
Price history
+15880.0% since first listed5 events — show timeline
- 2026-05-29 Listed $799,000 BRIGHT MLS
- 2025-04-30 Listing Removed — BRIGHT MLS
- 2024-12-03 Listed $825,000 BRIGHT MLS
- 2021-11-03 Sold (Public Records) $5,000 Public Records
- 1985-07-19 Sold (Public Records) $886 Public Records
Property tax history
+0.7%/yrLatest (2025): $2,369 · +0.9% YoY. Source: county tax records.
Cash-flow waterfall
monthlySold comps — $/sqft
last 12 mo · ≤1 miLoading sold comps…