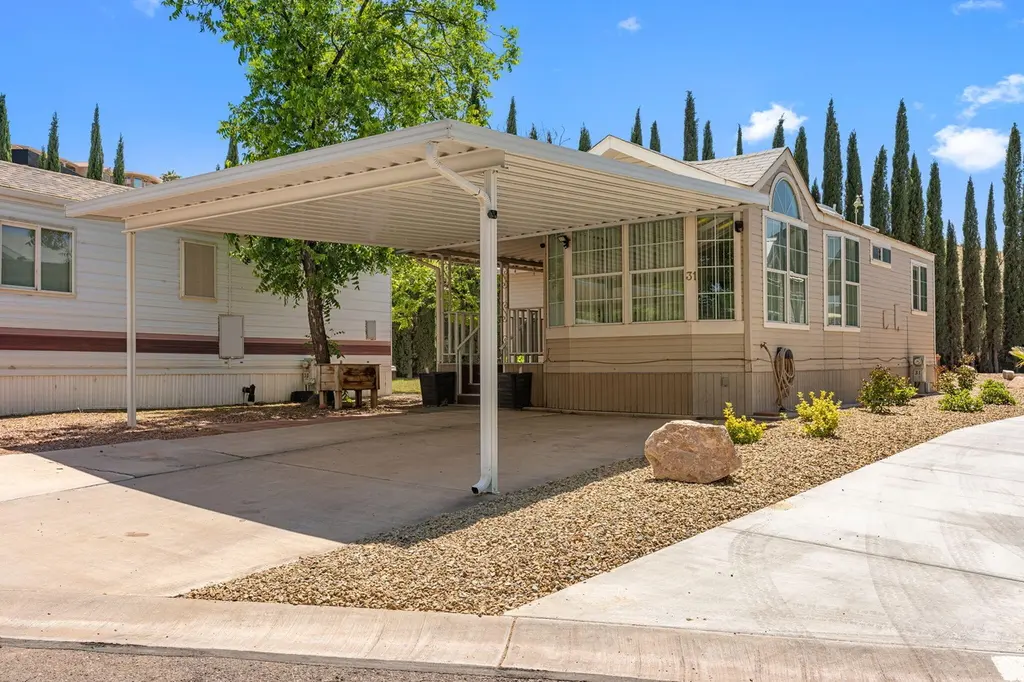
1160 E Telegraph St #31
Washington, UT 84780
$209,900D-
2 bd · 2.0 ba ·
644 sqft ·
Built 1999
· Manufactured
· Active
· 37 DOM
Cashflow @ list (25.0% down · 7.5%)
Estimated rent
$1,728/mo
Mortgage (P&I)
−$1,101
Tax + insurance
−$134
HOA
−$155
Vac / Maint / Mgmt
−$363
Net cashflow
$-24/mo
Annual
$-294/yr
Cap rate
6.15%
Cash-on-cash
-0.50%
DSCR
0.98
1% rule
0.82%
Cash to close
$58,772
Investor read
- This is a 2-bed/2.0-bath manufactured listed at $210k.
- At list price, monthly cash flow is $-24 ($-294/yr) — negative.
- To cash-flow at today's rent, offer at most $206k (2.1% below list).
- To meet the 1% rule (rent ≥ 1% of price), the offer needs to be $173k (17.7% below list).
- It's been on market 37 days — a 3% lower offer ($204k) is reasonable based on typical stale-listing flexibility.
- Recommended offer: $173k (17.7% below list) — sets the bar for 1% rule.
- Local home prices are declining (-3.0%/yr); year-one equity from $1k of loan paydown is wiped out by about $6k of value loss. Plan a longer hold.
- Location reads 75/100 on livability (#59 in UT, #3,809 nationally) — a middle-class / working-renter tenant base. Strengths: commute A+, employment A+, housing A+; Watch: cost of living D, amenities F, health & safety F.
- Washington District (urban): math 42% / reading 45% proficiency, ranked #37 of 80 in UT (top 46%) — families likely to look elsewhere, expect single-tenant / working-renter base with shorter leases.
- Zoned schools: Pine View High (math 29% / reading 48%, grade F, #74 of 171 statewide, top 43%, 1,143 students, 33% FRL) — zoned schools at 33% FRL track the district average.
- Market conditions: Rents soft (-0.1%/yr); 1024 active listings in the ZIP; 3 comparable units currently listed for rent nearby; rentals leasing fast (median 13d on market — plan ~1-2 weeks tenant-placement turnaround); solid renter incomes; 3,140 units permitted in Washington County in 2024 (650 in 5+ unit buildings).
- Washington County population projected at +44% by 2050 — long-run rental-demand tailwind backs the buy-and-hold thesis.
- 3 sale attempts since 9y ago with the ask held roughly flat each time — persistent listings suggest the price (not the market) is what's stuck; bring a comps-based counter.
- Climate carrying-cost: major wildfire risk; extreme-heat days projected 5→13/yr by 2055 (HVAC capex compounding) — expect insurance premiums to compound above CPI over the hold.
Questions for listing agent
- What do current leases actually rent for vs. the listed asking? Can we see a recent rent roll and the last 12 months of T-12 income?
- It's been on market 37 days. Have you received any prior offers? Is the seller open to a 18% concession, seller financing, or rate buy-down credit?
- What does the HOA fee cover, when was the last increase, and are there any pending special assessments or reserve-fund shortfalls?
- Is there a deadline driving the sale (1031 exchange, divorce, estate, relocation)? That informs how much negotiation room exists.
- The area grade is low — what's the realistic commute time and amenity access for the typical tenant pool here? Any planned neighborhood developments (good or bad) we should know about?
- What's the average days-on-market for RENTAL listings here right now (not sales)? A rising rental-DOM trend means longer vacancies and softer asking-rent achievability than the comps imply.
- What's the recent tenant-quality profile in this submarket — average credit score on applications, eviction rate, late-payment / NSF rate, and stable-employment percentage? A property-management company in the area should have these aggregated.
- How much new for-sale + rental construction is in the pipeline within 1–3 miles? Heavy new supply typically softens prices + rents 12–24 months out; constrained supply supports both.
CashFlowRE · CFR-RJY9YB58GNN7Y6
· Data 22 h ago
cashflowre.app · 2026-05-29