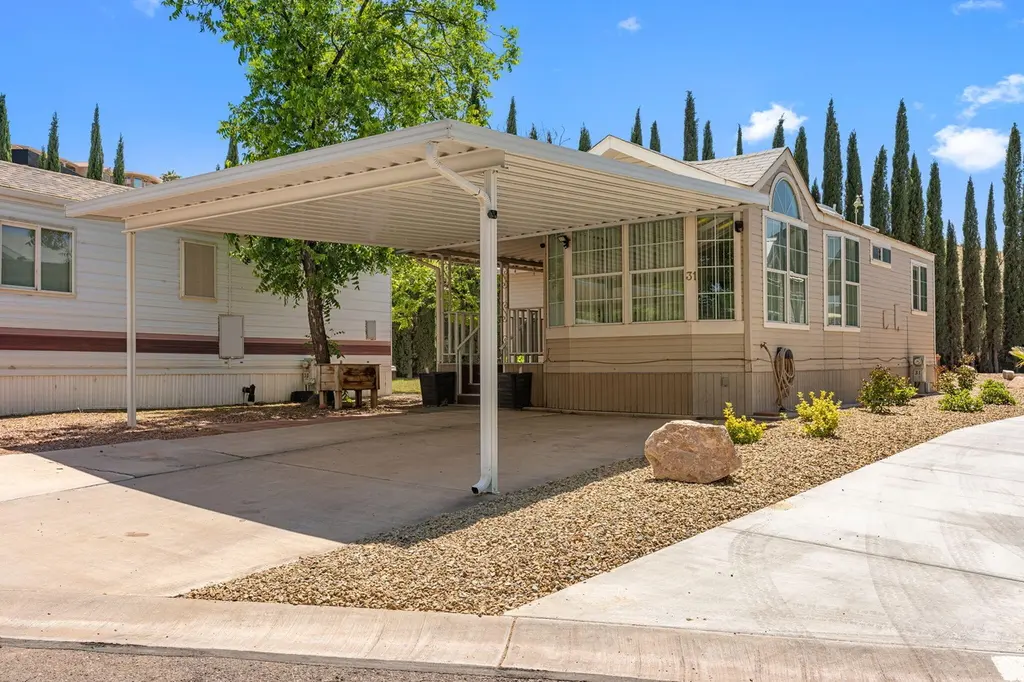
1160 E Telegraph St #31 · Washington, UT
Flood risk 1/10 · Minimal
- FEMA flood zone
- X (unshaded)
- Chance of flooding over 30 yrs
- 0.0%
- Est. flood insurance / yr
- $507 – $1,088
Fire risk 7/10 · Major
- Est. fire insurance / yr
- $453 – $841
Heat risk 7/10 · Major
- Hot days now (above 103°F)
- 5 days/yr
- Hot days in 30 yrs
- 13 days/yr
Wind risk 1/10 · Minimal
- Chance of severe wind over 30 yrs
- —
Air-quality risk 2/10 · Minimal
- Unhealthy air days now
- 0 days/yr
- Unhealthy air days in 30 yrs
- 1 days/yr
Risk factors via First Street. Map © Google.
Why this score? — see what drove the D- grade
The composite is a weighted blend of 9 inputs, each scored 0–100. Each bar is that input's sub-score; the figure is the points it added to the 100-point composite (weight × sub-score).
- Cash flow +12.7/30.0
- ARV discount +7.5/15.0
- DSCR +3.8/10.0
- Livability +3.8/5.0
- Schools +3.7/10.0
- 1% rule +3.2/10.0
- Rent growth +2.5/5.0
- Condition / age +2.5/5.0
- Appreciation +0.0/10.0
$209,900
🖨 Deal sheet 📄 Offer letter ✓ Due diligence
Listing remarks MLS
There are no remarks available.
Key facts
- Newer flooring
- Multi-level storage
- Murphy bed
Tags
Property features AI
Finance
- Other: PUD zoning
- HOA & community: Homeowners association with monthly fee of $155 (includes water); Clubhouse; Senior community
Exterior
- Parking: Carport with 2 spaces
- Utilities: Sewer available; Electricity connected; Natural gas connected
- Home design: Residential park model; Single-story
- Construction: Wood siding; Asphalt roof; Concrete perimeter foundation; Built as a park model
- Exterior features: Deck; Shed(s); Level lot; Paved road access
Interior
- Kitchen: Dishwasher; Disposal; Microwave; Range; Oven; Refrigerator
- Heating & cooling: Central air; Ceiling fan(s); Natural gas heating
- Interior features: Skylights; Window coverings
- Laundry & utility: Washer; Dryer
Neighborhood map
What this means for you Summary
Snapshot
- This is a 2-bed/2.0-bath manufactured listed at $210k.
Deal economics
- At list price, monthly cash flow is $-24 ($-294/yr) — negative.
- To cash-flow at today's rent, offer at most $206k (2.1% below list).
- To meet the 1% rule (rent ≥ 1% of price), the offer needs to be $173k (17.7% below list).
- Recommended offer: $173k (17.7% below list) — sets the bar for 1% rule.
Location & tenants
- Location reads 75/100 on livability (#59 in UT, #3,809 nationally) — a middle-class / working-renter tenant base. Strengths: commute A+, employment A+, housing A+; Watch: cost of living D, amenities F, health & safety F.
- Washington District (urban): math 42% / reading 45% proficiency, ranked #37 of 80 in UT (top 46%) — families likely to look elsewhere, expect single-tenant / working-renter base with shorter leases.
- Zoned schools: Pine View High (math 29% / reading 48%, grade F, #74 of 171 statewide, top 43%, 1,143 students, 33% FRL) — zoned schools at 33% FRL track the district average.
- Market conditions: Rents soft (-0.1%/yr); 1024 active listings in the ZIP; 3 comparable units currently listed for rent nearby; rentals leasing fast (median 13d on market — plan ~1-2 weeks tenant-placement turnaround); solid renter incomes; 3,140 units permitted in Washington County in 2024 (650 in 5+ unit buildings).
Forward outlook
- Local home prices are declining (-3.0%/yr); year-one equity from $1k of loan paydown is wiped out by about $6k of value loss. Plan a longer hold.
- Washington County population projected at +44% by 2050 — long-run rental-demand tailwind backs the buy-and-hold thesis.
Negotiation context
- It's been on market 37 days — a 3% lower offer ($204k) is reasonable based on typical stale-listing flexibility.
- 3 sale attempts since 9y ago with the ask held roughly flat each time — persistent listings suggest the price (not the market) is what's stuck; bring a comps-based counter.
Risks & watch-outs
- Climate carrying-cost: major wildfire risk; extreme-heat days projected 5→13/yr by 2055 (HVAC capex compounding) — expect insurance premiums to compound above CPI over the hold.
Questions for the listing agent
- What do current leases actually rent for vs. the listed asking? Can we see a recent rent roll and the last 12 months of T-12 income?
- It's been on market 37 days. Have you received any prior offers? Is the seller open to a 18% concession, seller financing, or rate buy-down credit?
- What does the HOA fee cover, when was the last increase, and are there any pending special assessments or reserve-fund shortfalls?
- Is there a deadline driving the sale (1031 exchange, divorce, estate, relocation)? That informs how much negotiation room exists.
- The area grade is low — what's the realistic commute time and amenity access for the typical tenant pool here? Any planned neighborhood developments (good or bad) we should know about?
- What's the average days-on-market for RENTAL listings here right now (not sales)? A rising rental-DOM trend means longer vacancies and softer asking-rent achievability than the comps imply.
- What's the recent tenant-quality profile in this submarket — average credit score on applications, eviction rate, late-payment / NSF rate, and stable-employment percentage? A property-management company in the area should have these aggregated.
- How much new for-sale + rental construction is in the pipeline within 1–3 miles? Heavy new supply typically softens prices + rents 12–24 months out; constrained supply supports both.
Investment metrics
- 1% rule
- 0.82% ✗
- Cap rate
- 6.15%
- Cash-on-cash
- -0.50%
- DSCR
- 0.98
- GRM
- 10.1
CMA / ARV
No comps found within radius.
Projected returns pro-forma
-3.0% appreciation · 0.0% rent growth · sell at horizon
- IRR
- -20.4%
- Equity multiple
- 0.31×
- Total profit
- $-40,648
- Equity at exit
- $31,297
- IRR
- -21.7%
- Equity multiple
- 0.03×
- Total profit
- $-57,020
- Equity at exit
- $18,148
Cash invested: $58,772 (down + closing). Projections, not guarantees.
Landlord ↔ Tenant lean methodology
- Overall (STATE)
- 86 Strongly Landlord-Friendly
- State Utah
- 86 Strongly Landlord-Friendly · R+15
- County
- — inherits STATE
- City
- — inherits STATE
ZIP-level market 84780
- Rents YoY
- -0.1%
- Active inventory
- 1024
- Price-to-rent
- 10.1×
Monthly cashflow live
- Estimated rent
- $1,728 medium interval (Pro) →
- Mortgage (P&I)
- −$1,101
- Tax from tax record
- −$46 /mo · $556/yr
- Insurance
- −$87
- HOA
- −$155
- Vacancy / Maint / Mgmt
- −$363
- Net cashflow
- $-24
Break-even live
UW: 25.0% down · 7.5% · 30yr · 1.5% tax · 5.0% vac · 8.0% maint · 8.0% mgmt
Financing live
Cash to close
- Down payment
- $52,475
- Closing costs
- $6,297
- Reserves months
- —
- Total cash needed
- —
Loan-product check · same deal, 3 products live
Conventional
25% down · 7.5% · 30yr
- Down + closing
- —
- Monthly P&I
- —
- Monthly cashflow
- —
- DSCR
- —
- Eligible?
- —
Personal DTI + credit; lowest rate.
DSCR
20% down · 8.5% · 30yr
- Down + closing
- —
- Monthly P&I
- —
- Monthly cashflow
- —
- DSCR
- —
- Eligible?
- —
No personal income docs; deal must DSCR.
Hard money
10% down · 12.0% · 12mo
- Down + closing
- —
- Monthly P&I
- —
- Monthly cashflow
- —
- DSCR
- —
- Eligible?
- —
Short-term bridge; refi at stabilization.
Rent comps 3 comps
| Address | Beds | Baths | Sqft | Rent | $/sqft | DOM | Units | Dist |
|---|---|---|---|---|---|---|---|---|
| 45 N Red Trail Ln Washington, UT | 2.0 | 1.0–2.0 | 699 | $1,649 | $2.36 | 13d | 1 | 0.29mi |
| 190 N Red Stone Rd Washington, UT | 1.0–3.0 | 1.0–2.0 | 943 | $1,674 | $1.77 | 13d | 10 | 0.62mi |
| 1165 E Bulloch St Washington, UT | 1.0–3.0 | 1.0–2.5 | 1210 | $1,724 | $1.42 | 13d | 8 | 0.82mi |
HOA detail
- Monthly dues
- $155 · $1,860/yr
Listing history 23 events
-
2026-06-19days on market $209,900 Active 37 DOM
-
2026-06-18days on market $209,900 Active 36 DOM
-
2026-06-17days on market $209,900 Active 35 DOM
-
2026-06-16days on market $209,900 Active 34 DOM
-
2026-06-15days on market $209,900 Active 33 DOM
-
2026-06-14days on market $209,900 Active 31 DOM
-
2026-06-13days on market $209,900 Active 30 DOM
-
2026-06-10days on market $209,900 Active 28 DOM
-
2026-06-09days on market $209,900 Active 27 DOM
-
2026-06-08days on market $209,900 Active 26 DOM
-
2026-06-07days on market $209,900 Active 25 DOM
-
2026-06-05days on market $209,900 Active 22 DOM
-
2026-06-02days on market $209,900 Active 20 DOM
-
2026-06-01days on market $209,900 Active 19 DOM
-
2026-05-31days on market $209,900 Active 18 DOM
-
2026-05-30days on market $209,900 Active 17 DOM
-
2026-05-13$209,900 Active
-
2021-08-23soldstatus
-
2021-07-13status Under Contract 31-char remark
Show marketing remark (31 chars)
There are no remarks available.
-
2021-06-26$190,000 Active 31-char remark
Show marketing remark (31 chars)
There are no remarks available.
-
2017-05-23historical
-
2017-01-30soldstatus
-
2017-01-13$249,900
ⓘ Source: listings_history table (triggers on properties + properties_extension) + one-shot
backfill from property_details.listing_events for pre-trigger history.
Tax reassessment forecast UT · Resets to sale price
- Current annual tax
- $556 · $46/mo
- Projected year-2 tax
- $1,385 · $115/mo
- Expected delta
- +$829/yr (+$69/mo · 149.0%)
ⓘ Screening estimate from a state-policy table — verify with the county assessor before closing.
Climate risk First Street
- Flood 1/10 Low FEMA zone X (unshaded) · 0% chance over 30 yrs
- Wildfire 7/10 Severe
- Heat 7/10 Severe 5 d/yr ≥103°F today · 13 d/yr by 30 yrs out
- Wind 1/10 Low
- Air quality 2/10 Low 0 unhealthy d/yr today · 1 by 30 yrs out
Nearby sold comps map
Loading sold comps map…
Walkable amenities ~0.75 mi
Loading nearby amenities…
Taxation est. · year 1
- Rental income
- $20,735
- − Mortgage interest
- −$11,758
- − Property taxes
- −$556
- − Insurance
- −$1,050
- − Repairs & maintenance
- −$1,659
- − Management
- −$1,659
- − HOA
- −$1,860
- − Depreciation
- −$6,106
- Taxable loss
- −$3,912
- Est. tax savings @ 24.0%
- +$939
- After-tax cash flow
- $645/yr
For passive investors: Depreciation is non-cash, so a rental often shows a tax loss while cash-flowing — sheltering income. Rental losses are passive: they offset passive income freely, and up to $25,000/yr can offset ordinary (W-2) income if you actively participate and your MAGI is under $100k (phasing out to $0 by $150k); unused losses carry forward. On sale, claimed depreciation is recaptured at up to 25%, and gains may owe capital-gains tax (a 1031 exchange can defer both). Figures are a year-1 estimate at your 24.0% rate — not tax advice; consult a CPA.
Schools (NCES district)
- District
- Washington District
- NCES district ID
- 4901140
- Math proficiency
- 42% ▼ -3.00%
- Reading proficiency
- 45% ▼ -3.00%
- Median HH income
- $50,861
- Composite
- 37.47/100
- National rank
- #4408
- State rank
- #37 of 80 in UT
Livability — Washington
- Score
- 75/100
- State rank
- #59
- US rank
- #3809
Category grades
Schools grade is shown separately in the Schools card above.
Census & demographics
- Census place
- Washington, UT
- County
- Washington County · 179,216 people
- City population
- 32,366
- Metro
- St. George, UT
- Population (ZIP)
- 32,366
- Household income
- $91,963
- Rent vs Own
- Severe rent burden
- 1036.0
Population outlook (Washington County) Hauer SSP2
- Today (2025)
- 193,324 people
- By 2030
- 211,699 · +9.5%
- By 2040
- 246,449 · +27.5%
- By 2050
- 278,447 · +44.0%
- By 2075
- 342,734 · +77.3%
- By 2100
- 382,815 · +98.0%
Race, ethnicity, and origin ACS 2023
- Neighborhood character
- Predominantly White (77%)
- Race & ethnicity
- White 77% Hispanic / Latino 17% Two or more races 9%
- Hispanic origin (detail)
- Mexican 11% Puerto Rican 1%
- Common ancestry
- Italian 6% Slovak 5% Lithuanian 3%
- Foreign-born
- 5% · Canada, Jamaica, China
- Languages at home
- 89% English-only · Spanish 8% Chinese 1% German/W. Germanic 1%
Political lean MEDSL · Washington
- 2024 margin
- Solid R (+52.3) · D 23.0% · R 75.2% · Other 1.8%
- 2008→2024 swing
- +1.2pp toward D · 2008: -53.5pp · 2024: -52.3pp
- All cycles
- 2024: R+52.3 2020: R+51.7 2016: R+52.1 2012: R+67.0 2008: R+53.5
Not yet ingested
- Civics
- —
Market trends
- HPI YoY
- ▼ -144.73%
- Current HPI
- 248.9421
- Rent YoY
- ▼ -0.06%
- Metro
- St. George, UT
- State GDP YoY
- ▲ 3.54%
- F500 in state
- 2
Industry mix (Fortune 500 HQ in UT)
| Industry | F500 HQs | Revenue |
|---|---|---|
| Financial Services | 1 | $3B |
|
||
Price history
-16.0% since first listed7 events — show timeline
- 2026-05-13 Listed $209,900 WCBOR
- 2021-08-23 Sold (Public Records) — Public Records
- 2021-07-13 Pending — WFRMLS
- 2021-06-26 Listed $190,000 WFRMLS
- 2017-05-23 Listing Removed — WFRMLS
- 2017-01-30 Sold (Public Records) — Public Records
- 2017-01-13 Listed $249,900 WFRMLS
Property tax history
+4.6%/yrLatest (2025): $556 · +4.9% YoY. Source: county tax records.
Cash-flow waterfall
monthlySold comps — $/sqft
last 12 mo · ≤1 miLoading sold comps…