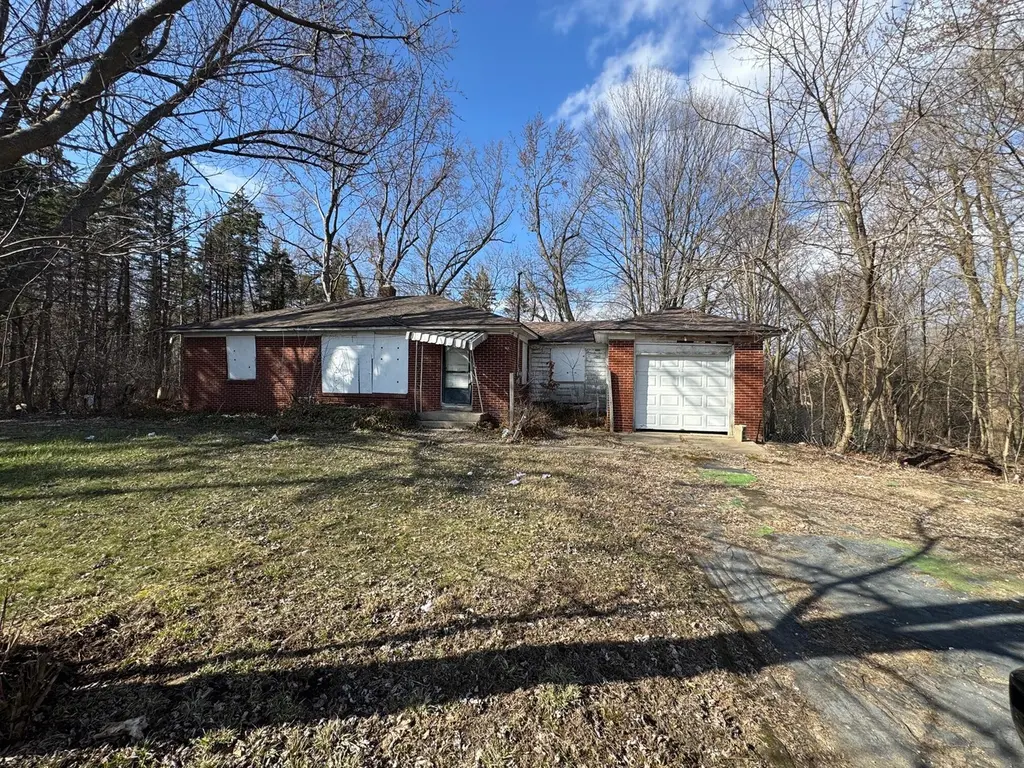
1689 60th St SE
Kentwood, MI 49508
$190,000B+
4 bd · 1.0 ba ·
988 sqft ·
Built 1954
· SingleFamily
· Active
· 238 DOM
Cashflow @ list (25.0% down · 7.5%)
Estimated rent
$2,593/mo
Mortgage (P&I)
−$996
Tax + insurance
−$211
HOA
−$0
Vac / Maint / Mgmt
−$544
Net cashflow
$841/mo
Annual
$10,088/yr
Cap rate
11.60%
Cash-on-cash
18.96%
DSCR
1.84
1% rule
1.36%
Cash to close
$53,200
Investor read
- This is a 4-bed/1.0-bath single-family listed at $190k.
- At list price, monthly cash flow is $841 ($10k/yr) — positive.
- The deal already cash-flows at list — no discount required.
- Meets the 1% rule at list price ($3k rent vs $190k).
- It's been on market 238 days — a 12% lower offer ($167k) is reasonable based on typical stale-listing flexibility.
- Recommended offer: $167k (12.0% below list) — sets the bar for market timing.
- Local home prices are declining (-3.0%/yr); year-one equity from $1k of loan paydown is wiped out by about $6k of value loss. Plan a longer hold.
- Location reads 74/100 on livability (#191 in MI, #4,892 nationally) — a middle-class / working-renter tenant base. Strengths: cost of living A+, housing A+, schools A-; Watch: commute C-, crime D, amenities F.
- Kentwood Public Schools (suburban): math 34% / reading 46% proficiency, ranked #206 of 540 in MI (top 38%) — families likely to look elsewhere, expect single-tenant / working-renter base with shorter leases.
- Watch-outs: built in 1954 — expect roof / HVAC / electrical / plumbing capex.
- Market conditions: Rents rising fast (+5.6%/yr); 155 active listings in the ZIP; 2 comparable units currently listed for rent nearby; 2,253 units permitted in Kent County in 2024 (969 in 5+ unit buildings).
- Kent County population projected at +22% by 2050 — long-run rental-demand tailwind backs the buy-and-hold thesis.
- 8 sale attempts since 4y ago with the ask held roughly flat each time — persistent listings suggest the price (not the market) is what's stuck; bring a comps-based counter.
- Current owner paid $130k; 46% above their basis — modest negotiation headroom, anchor on the comps not their cost.
- At projected returns (-3.0% appreciation + 5.6% rent growth), your $53k cash investment doubles in ~6 years — after that, you're playing with house money.
- Cap rate 11.6% vs local median 3.7% in Kentwood — top-decile yield for the area; either an underpriced asset or a hidden risk that comps aren't pricing in. Stress-test before assuming the spread holds.
- This rent runs 44% of the median local income ($70k/yr) — at the standard rent-burdened threshold; future hikes will face affordability resistance.
Questions for listing agent
- It's been on market 238 days. Have you received any prior offers? Is the seller open to a 12% concession, seller financing, or rate buy-down credit?
- Built in 1954 — when were the roof, HVAC, electrical panel, plumbing, and water heater last replaced?
- Why hasn't it sold? Are there any deal-killer items the seller is aware of (foundation, flood, title, zoning, code violations)?
- Is there a deadline driving the sale (1031 exchange, divorce, estate, relocation)? That informs how much negotiation room exists.
- Schools are A-rated — typically a magnet for longer-tenancy family renters. What's the average tenant stay here, and is there a school-zone premium baked into asking?
- Crime grade is D in this area — have there been break-ins, vandalism, or insurance claims at this property in the last 3 years? What carrier currently insures it and at what premium?
- What's the average days-on-market for RENTAL listings here right now (not sales)? A rising rental-DOM trend means longer vacancies and softer asking-rent achievability than the comps imply.
- What's the recent tenant-quality profile in this submarket — average credit score on applications, eviction rate, late-payment / NSF rate, and stable-employment percentage? A property-management company in the area should have these aggregated.
CashFlowRE · CFR-RK3RBY2ZMJNW7M
· Data 2 days ago
cashflowre.app · 2026-05-29