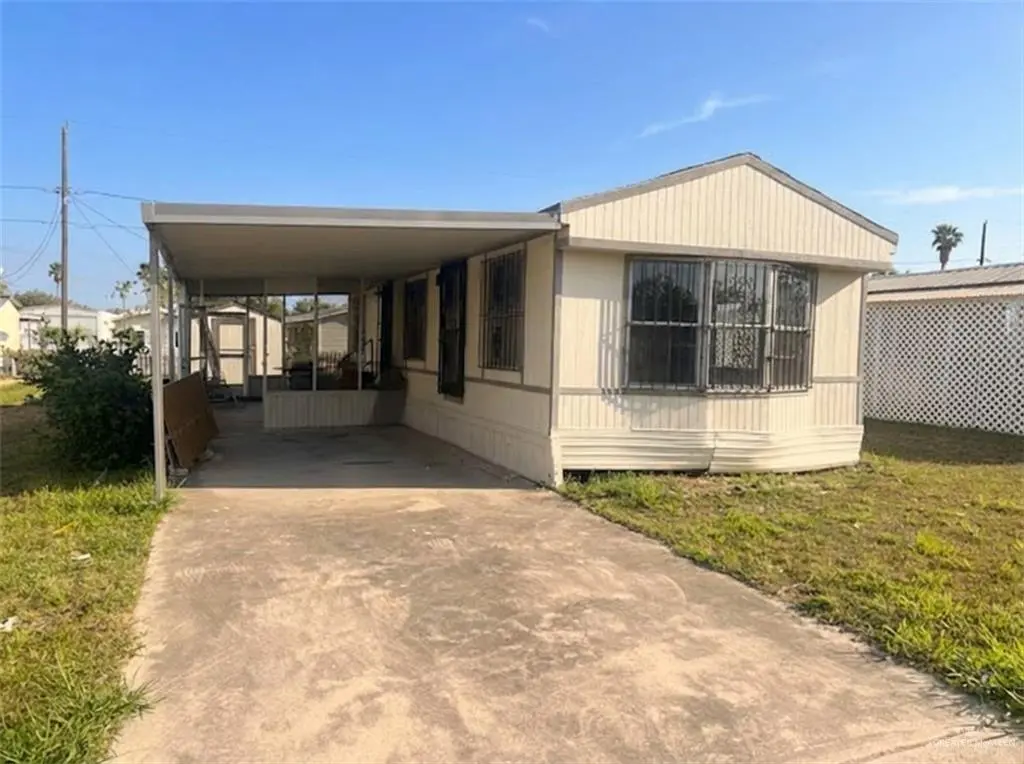
87 Lampshire
Palmview, TX 78572
$37,990B
3 bd · 1.0 ba ·
560 sqft ·
Built 1984
· Manufactured
· Active
· 9 DOM
Cashflow @ list (25.0% down · 7.5%)
Estimated rent
$1,222/mo
Mortgage (P&I)
−$199
Tax + insurance
−$89
HOA
−$27
Vac / Maint / Mgmt
−$257
Net cashflow
$650/mo
Annual
$7,799/yr
Cap rate
26.82%
Cash-on-cash
73.31%
DSCR
4.26
1% rule
3.22%
Cash to close
$10,637
Investor read
- This is a 3-bed/1.0-bath manufactured listed at $38k.
- At list price, monthly cash flow is $650 ($8k/yr) — positive.
- The deal already cash-flows at list — no discount required.
- Meets the 1% rule at list price ($1k rent vs $38k).
- Only 9 days on market — expect competitive offers; lowballing is unlikely to land.
- Local home prices are declining (-3.0%/yr); year-one equity from $262 of loan paydown is wiped out by about $1k of value loss. Plan a longer hold.
- Location reads 57/100 on livability (#1,267 in TX) — a working-class tenant base; expect higher turnover. Strengths: cost of living A+, housing A; Watch: crime D, amenities F, commute F.
- La Joya ISD (suburban): math 18% / reading 29% proficiency, ranked #759 of 826 in TX (top 92%) — low school quality limits family demand, transient renter base, plan for 1-2y turnover.
- Zoned schools: Leo J Leo El (math 27% / reading 32%, grade F, #2,525 of 4,322 statewide, top 62%, 372 students, 92% FRL); Memorial Middle (math 24% / reading 30%, grade F, #1,177 of 1,662 statewide, top 72%, 700 students, 84% FRL); La Joya H S (math 16% / reading 32%, grade F, #1,333 of 1,632 statewide, top 82%, 2,775 students, 92% FRL) — zoned schools average 90% FRL vs 54% district-wide (36 pts higher); higher-poverty schools than district average — tighter screening recommended.
- Market conditions: Rents flat; 852 active listings in the ZIP; 2 comparable units currently listed for rent nearby; 7,378 units permitted in Hidalgo County in 2024 (641 in 5+ unit buildings).
- Hidalgo County population projected at +28% by 2050 — long-run rental-demand tailwind backs the buy-and-hold thesis.
- 5 sale attempts since 2y ago with the ask held roughly flat each time — persistent listings suggest the price (not the market) is what's stuck; bring a comps-based counter.
- At projected returns (-3.0% appreciation + 0.9% rent growth), your $11k cash investment doubles in ~2 years — after that, you're playing with house money.
- Climate carrying-cost: severe wind risk, 93% chance of damaging wind over 30y; severe wildfire risk; extreme-heat days projected 7→22/yr by 2055 (HVAC capex compounding) — expect insurance premiums to compound above CPI over the hold.
- Cap rate 26.8% vs local median 4.2% in Palmview — top-decile yield for the area; either an underpriced asset or a hidden risk that comps aren't pricing in. Stress-test before assuming the spread holds.
Questions for listing agent
- What does the HOA fee cover, when was the last increase, and are there any pending special assessments or reserve-fund shortfalls?
- Is there a deadline driving the sale (1031 exchange, divorce, estate, relocation)? That informs how much negotiation room exists.
- Schools are F-rated, which usually means shorter tenancies and higher turnover. Who's the typical renter profile here, and what's been the actual vacancy rate?
- Crime grade is D in this area — have there been break-ins, vandalism, or insurance claims at this property in the last 3 years? What carrier currently insures it and at what premium?
- What's the average days-on-market for RENTAL listings here right now (not sales)? A rising rental-DOM trend means longer vacancies and softer asking-rent achievability than the comps imply.
- What's the recent tenant-quality profile in this submarket — average credit score on applications, eviction rate, late-payment / NSF rate, and stable-employment percentage? A property-management company in the area should have these aggregated.
- How much new for-sale + rental construction is in the pipeline within 1–3 miles? Heavy new supply typically softens prices + rents 12–24 months out; constrained supply supports both.
CashFlowRE · CFR-RM8EH82XVMQQSC
· Data 1 week ago
cashflowre.app · 2026-05-29