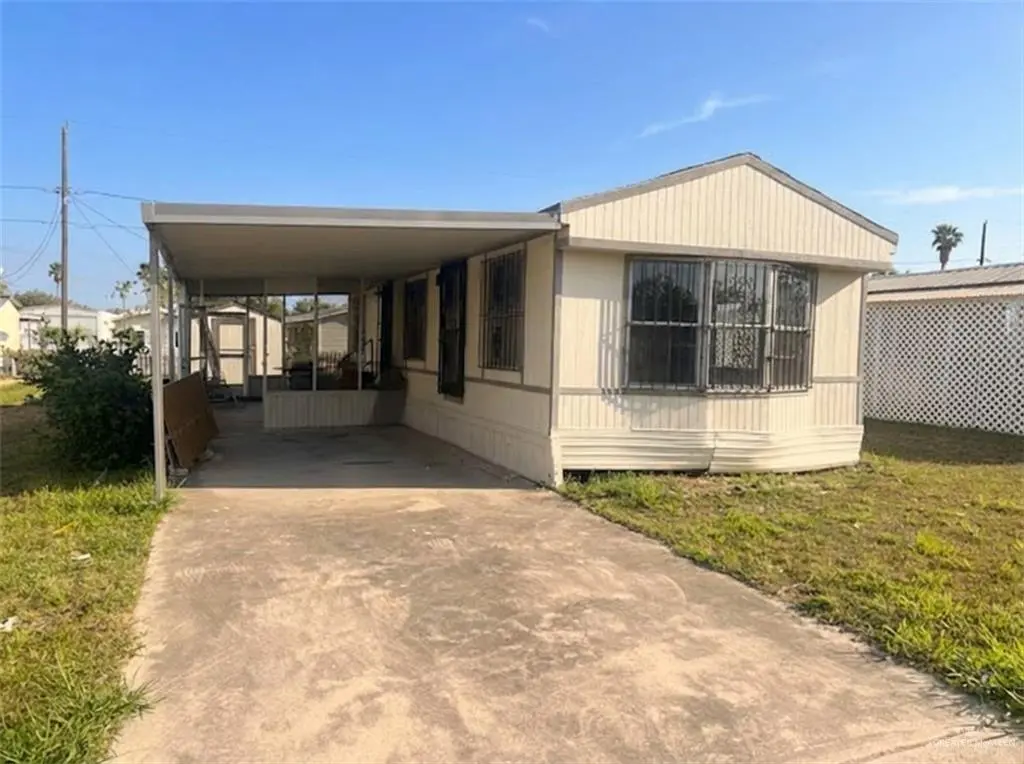
87 Lampshire · Palmview, TX
Flood risk 1/10 · Minimal
- FEMA flood zone
- X
- Chance of flooding over 30 yrs
- 0.0%
- Est. flood insurance / yr
- $507 – $1,088
Fire risk 8/10 · Major
- Est. fire insurance / yr
- $1,222 – $2,270
Heat risk 9/10 · Severe
- Hot days now (above 112°F)
- 7 days/yr
- Hot days in 30 yrs
- 22 days/yr
Wind risk 8/10 · Major
- Chance of severe wind over 30 yrs
- 93.0%
Air-quality risk 1/10 · Minimal
- Unhealthy air days now
- 0 days/yr
- Unhealthy air days in 30 yrs
- 0 days/yr
Risk factors via First Street. Map © Google.
Why this score? — see what drove the B grade
The composite is a weighted blend of 9 inputs, each scored 0–100. Each bar is that input's sub-score; the figure is the points it added to the 100-point composite (weight × sub-score).
- Cash flow +30.0/30.0
- ARV discount +15.0/15.0
- 1% rule +10.0/10.0
- DSCR +10.0/10.0
- Livability +2.9/5.0
- Rent growth +2.7/5.0
- Condition / age +2.5/5.0
- Schools +1.9/10.0
- Appreciation +0.0/10.0
$37,990
🖨 Deal sheet 📄 Offer letter ✓ Due diligence
Listing remarks
Welcome to 87 Lampshire in Palmview, TX, located in a peaceful 55+ community! This 1-bedroom, 1-bath mobile home offers a great opportunity for buyers looking to customize and add their personal touch. The home features a functional layout with comfortable living space and is perfect for those seeking a low-maintenance lifestyle. With a little TLC and updates, this property has great potential to shine. Enjoy the quiet surroundings and community atmosphere while being conveniently located near shopping, dining, and easy access to Expressway 83. Ideal for retirees or anyone looking for an affordable home in a welcoming community.
Key facts
- 5,035 sq ft lot
- Parking
- Pool
Property features AI
Finance
- Other: Property on owned lot; Green energy efficient: other
- Financial info: Tax year 2025 (amounts not included per instructions)
- HOA & community: Association: Lamplight Mobile Home; Annual association fee $325; POA mandatory with $175 transfer fee; Senior community
Exterior
- Parking: Total 1 parking space; Covered carport (1 covered space, has carport; no garage)
- Security: Details not provided
- Utilities: Sewer: MUD; Paved road access
- Home design: Mobile home lot (Lamplight Mobile Home); New construction: no
- Construction: Metal roof; Siding, including vinyl and wood siding; Built on crawl space with pillar/post/pier foundation; Storage structure on property
- Exterior features: Workshop; Covered patio, patio slab, screened patio; Community pool
Interior
- Kitchen: Water heater (other type); No conveying kitchen appliances
- Bedrooms: Details not provided
- Flooring: Laminate and other
- Bathrooms: 1 full bathroom
- Heating & cooling: Details not provided
- Interior features: Laminate and other flooring; Laminate countertops; Mini blinds and some windows without coverings; Living area: 1
- Laundry & utility: Laundry area with washer/dryer connections
Neighborhood map
What this means for you Summary
Snapshot
- This is a 3-bed/1.0-bath manufactured listed at $38k.
Deal economics
- At list price, monthly cash flow is $650 ($8k/yr) — positive.
- The deal already cash-flows at list — no discount required.
- Meets the 1% rule at list price ($1k rent vs $38k).
- Cap rate 26.8% vs local median 4.2% in Palmview — top-decile yield for the area; either an underpriced asset or a hidden risk that comps aren't pricing in. Stress-test before assuming the spread holds.
Location & tenants
- Location reads 57/100 on livability (#1,267 in TX) — a working-class tenant base; expect higher turnover. Strengths: cost of living A+, housing A; Watch: crime D, amenities F, commute F.
- La Joya ISD (suburban): math 18% / reading 29% proficiency, ranked #759 of 826 in TX (top 92%) — low school quality limits family demand, transient renter base, plan for 1-2y turnover.
- Zoned schools: Leo J Leo El (math 27% / reading 32%, grade F, #2,525 of 4,322 statewide, top 62%, 372 students, 92% FRL); Memorial Middle (math 24% / reading 30%, grade F, #1,177 of 1,662 statewide, top 72%, 700 students, 84% FRL); La Joya H S (math 16% / reading 32%, grade F, #1,333 of 1,632 statewide, top 82%, 2,775 students, 92% FRL) — zoned schools average 90% FRL vs 54% district-wide (36 pts higher); higher-poverty schools than district average — tighter screening recommended.
- Market conditions: Rents flat; 852 active listings in the ZIP; 2 comparable units currently listed for rent nearby; 7,378 units permitted in Hidalgo County in 2024 (641 in 5+ unit buildings).
Forward outlook
- Local home prices are declining (-3.0%/yr); year-one equity from $262 of loan paydown is wiped out by about $1k of value loss. Plan a longer hold.
- Hidalgo County population projected at +28% by 2050 — long-run rental-demand tailwind backs the buy-and-hold thesis.
- At projected returns (-3.0% appreciation + 0.9% rent growth), your $11k cash investment doubles in ~2 years — after that, you're playing with house money.
Negotiation context
- Only 9 days on market — expect competitive offers; lowballing is unlikely to land.
- 5 sale attempts since 2y ago with the ask held roughly flat each time — persistent listings suggest the price (not the market) is what's stuck; bring a comps-based counter.
Risks & watch-outs
- Climate carrying-cost: severe wind risk, 93% chance of damaging wind over 30y; severe wildfire risk; extreme-heat days projected 7→22/yr by 2055 (HVAC capex compounding) — expect insurance premiums to compound above CPI over the hold.
Questions for the listing agent
- What does the HOA fee cover, when was the last increase, and are there any pending special assessments or reserve-fund shortfalls?
- Is there a deadline driving the sale (1031 exchange, divorce, estate, relocation)? That informs how much negotiation room exists.
- Schools are F-rated, which usually means shorter tenancies and higher turnover. Who's the typical renter profile here, and what's been the actual vacancy rate?
- Crime grade is D in this area — have there been break-ins, vandalism, or insurance claims at this property in the last 3 years? What carrier currently insures it and at what premium?
- What's the average days-on-market for RENTAL listings here right now (not sales)? A rising rental-DOM trend means longer vacancies and softer asking-rent achievability than the comps imply.
- What's the recent tenant-quality profile in this submarket — average credit score on applications, eviction rate, late-payment / NSF rate, and stable-employment percentage? A property-management company in the area should have these aggregated.
- How much new for-sale + rental construction is in the pipeline within 1–3 miles? Heavy new supply typically softens prices + rents 12–24 months out; constrained supply supports both.
Investment metrics
- 1% rule
- 3.22% ✓
- Cap rate
- 26.82%
- Cash-on-cash
- 73.31%
- DSCR
- 4.26
- GRM
- 2.6
CMA / ARV
- ARV (median comp)
- $50,036
- List price
- $37,990
- Delta
- -22.36%
- Verdict
- UNDERPRICED
- Comps
- 17 within 1.0 mi
Projected returns pro-forma
-3.0% appreciation · 0.93% rent growth · sell at horizon
- IRR
- 70.6%
- Equity multiple
- 4.08×
- Total profit
- $32,792
- Equity at exit
- $5,664
- IRR
- 74.0%
- Equity multiple
- 7.79×
- Total profit
- $72,244
- Equity at exit
- $3,285
Cash invested: $10,637 (down + closing). Projections, not guarantees.
Landlord ↔ Tenant lean methodology
- Overall (STATE)
- 87 Strongly Landlord-Friendly
- State Texas
- 87 Strongly Landlord-Friendly · R+5
- County
- — inherits STATE
- City
- — inherits STATE
ZIP-level market 78572
- Home prices YoY
- -22.9%
- Rents YoY
- 0.9%
- Active inventory
- 852
- Price-to-rent
- 2.6×
Monthly cashflow live
- Estimated rent
- $1,222 medium interval (Pro) →
- Mortgage (P&I)
- −$199
- Tax from tax record
- −$73 /mo · $880/yr
- Insurance
- −$16
- HOA
- −$27
- Vacancy / Maint / Mgmt
- −$257
- Net cashflow
- $650
Break-even live
UW: 25.0% down · 7.5% · 30yr · 1.5% tax · 5.0% vac · 8.0% maint · 8.0% mgmt
Financing live
Cash to close
- Down payment
- $9,498
- Closing costs
- $1,140
- Reserves months
- —
- Total cash needed
- —
Loan-product check · same deal, 3 products live
Conventional
25% down · 7.5% · 30yr
- Down + closing
- —
- Monthly P&I
- —
- Monthly cashflow
- —
- DSCR
- —
- Eligible?
- —
Personal DTI + credit; lowest rate.
DSCR
20% down · 8.5% · 30yr
- Down + closing
- —
- Monthly P&I
- —
- Monthly cashflow
- —
- DSCR
- —
- Eligible?
- —
No personal income docs; deal must DSCR.
Hard money
10% down · 12.0% · 12mo
- Down + closing
- —
- Monthly P&I
- —
- Monthly cashflow
- —
- DSCR
- —
- Eligible?
- —
Short-term bridge; refi at stabilization.
Rent comps 2 comps
| Address | Beds | Baths | Sqft | Rent | $/sqft | DOM | Units | Dist |
|---|---|---|---|---|---|---|---|---|
| 4321 Royal Palm Dr Mission, TX | 2.0 | 1.0 | 572 | $800 | $1.40 | 23d | 1 | 0.52mi |
| 2508 U.S. 83 Business Unit 16 Mission, TX | 2.0 | 1.0 | 650 | $730 | $1.12 | 23d | 1 | 1.31mi |
HOA detail
- Monthly dues
- $27 · $324/yr
Listing history 21 events
-
2026-06-10days on market $37,990 Active 9 DOM
-
2026-06-09days on market $37,990 Active 8 DOM
-
2026-06-08days on market $37,990 Active 7 DOM
-
2026-06-07days on market $37,990 Active 6 DOM
-
2026-06-05days on market $37,990 Active 3 DOM
-
2026-06-03days on market $37,990 Active 2 DOM
-
2026-06-02pricedays on market $37,990 Active 1 DOM
-
2026-06-01days on market $38,850 Active 26 DOM
-
2026-05-31days on market $38,850 Active 25 DOM
-
2026-05-31days on market $38,850 Active 24 DOM
-
2026-05-15price $39,850 636-char remark
-
2026-05-09price $39,900 636-char remark
-
2026-05-06$44,000 Active 636-char remark
-
2026-04-20price $45,000
-
2026-04-10$49,900 Active
-
2026-04-07$75,000 Active
-
2024-08-01$50,000 Active
-
2009-09-24soldstatus
-
2007-11-15soldstatus
-
2007-11-15soldstatus
-
2007-11-15soldstatus
ⓘ Source: listings_history table (triggers on properties + properties_extension) + one-shot
backfill from property_details.listing_events for pre-trigger history.
Tax reassessment forecast TX · Resets to sale price
- Current annual tax
- $880 · $73/mo
- Projected year-2 tax
- $880 · $73/mo
- Expected delta
- $0/yr ($0/mo · 0.0%)
ⓘ Screening estimate from a state-policy table — verify with the county assessor before closing.
Climate risk First Street
- Flood 1/10 Low FEMA zone X · 0% chance over 30 yrs
- Wildfire 8/10 Severe
- Heat 9/10 Extreme 7 d/yr ≥112°F today · 22 d/yr by 30 yrs out
- Wind 8/10 Severe 93% chance of damaging wind over 30 yrs
- Air quality 1/10 Low 0 unhealthy d/yr today · 0 by 30 yrs out
Nearby sold comps map
Loading sold comps map…
Walkable amenities ~0.75 mi
Loading nearby amenities…
Taxation est. · year 1
- Rental income
- $14,663
- − Mortgage interest
- −$2,128
- − Property taxes
- −$880
- − Insurance
- −$190
- − Repairs & maintenance
- −$1,173
- − Management
- −$1,173
- − HOA
- −$324
- − Depreciation
- −$1,105
- Taxable income
- $7,689
- Est. tax owed @ 24.0%
- −$1,845
- After-tax cash flow
- $5,953/yr
For passive investors: Depreciation is non-cash, so a rental often shows a tax loss while cash-flowing — sheltering income. Rental losses are passive: they offset passive income freely, and up to $25,000/yr can offset ordinary (W-2) income if you actively participate and your MAGI is under $100k (phasing out to $0 by $150k); unused losses carry forward. On sale, claimed depreciation is recaptured at up to 25%, and gains may owe capital-gains tax (a 1031 exchange can defer both). Figures are a year-1 estimate at your 24.0% rate — not tax advice; consult a CPA.
Schools (NCES district)
- District
- La Joya ISD
- NCES district ID
- 4826130
- Math proficiency
- 18% ▼ -35.00%
- Reading proficiency
- 29% ▼ -10.00%
- Median HH income
- $27,845
- Composite
- 18.65/100
- National rank
- #8891
- State rank
- #759 of 826 in TX
Livability — Palmview
- Score
- 57/100
- State rank
- #1267
- US rank
- #22043
Category grades
Schools grade is shown separately in the Schools card above.
Census & demographics
- Census place
- Palmview, TX
- County
- Hidalgo County · 623,128 people
- Metro
- McAllen-Edinburg-Mission, TX
- Population (ZIP)
- 78,024
- Household income
- $54,298
- Rent vs Own
- Severe rent burden
- 1714.0
Population outlook (Hidalgo County) Hauer SSP2
- Today (2025)
- 955,232 people
- By 2030
- 1,009,774 · +5.7%
- By 2040
- 1,120,332 · +17.3%
- By 2050
- 1,225,036 · +28.2%
- By 2075
- 1,439,189 · +50.7%
- By 2100
- 1,533,429 · +60.5%
Race, ethnicity, and origin ACS 2023
- Neighborhood character
- Predominantly Hispanic (85%)
- Race & ethnicity
- Hispanic / Latino 85% Two or more races 47% White 12% Asian 2%
- Hispanic origin (detail)
- Mexican 80%
- Common ancestry
- Slovak 1% Portuguese 0%
- Foreign-born
- 28% · Canada, South Korea
- Languages at home
- 22% English-only · Spanish 76%
Political lean MEDSL · Hidalgo
- 2024 margin
- Toss-up / Even · D 48.1% · R 51.0%
- 2008→2024 swing
- -41.6pp toward R · 2008: 38.7pp · 2024: -2.9pp
- All cycles
- 2024: R+2.9 2020: D+17.1 2016: D+40.5 2012: D+41.8 2008: D+38.7
Not yet ingested
- Civics
- —
Market trends
- HPI YoY
- ▼ -62.35%
- Current HPI
- 209.3573
- Rent YoY
- ▲ 0.93%
- Metro
- McAllen-Edinburg-Mission, TX
- State GDP YoY
- ▲ 3.95%
- F500 in state
- 110
Industry mix (Fortune 500 HQ in TX)
| Industry | F500 HQs | Revenue |
|---|---|---|
| Energy | 16 | $1,198B |
|
||
| Technology | 5 | $198B |
|
||
| Engineering / Construction | 4 | $72B |
|
||
| Energy Services | 3 | $60B |
|
||
| Utilities | 3 | $41B |
|
||
| Healthcare | 2 | $330B |
|
||
Price history
-24.0% since first listed14 events — show timeline
- 2026-06-10 Sold (MLS) — MCALLENMLS
- 2026-06-01 Listed $37,990 MCALLENMLS
- 2026-05-24 Price Changed $38,850 MCALLENMLS
- 2026-05-15 Price Changed $39,850 MCALLENMLS
- 2026-05-09 Price Changed $39,900 MCALLENMLS
- 2026-05-06 Listed $44,000 MCALLENMLS
- 2026-04-20 Price Changed $45,000 MCALLENMLS
- 2026-04-10 Listed $49,900 MCALLENMLS
- 2026-04-07 Listed $75,000 MCALLENMLS
- 2024-08-01 Listed $50,000 MCALLENMLS
- 2009-09-24 Sold (Public Records) — Public Records
- 2007-11-15 Sold (Public Records) — Public Records
- 2007-11-15 Sold (Public Records) — Public Records
- 2007-11-15 Sold (Public Records) — Public Records
Property tax history
+7.3%/yrLatest (2025): $880 · +8.6% YoY. Source: county tax records.
Cash-flow waterfall
monthlySold comps — $/sqft
last 12 mo · ≤1 miLoading sold comps…