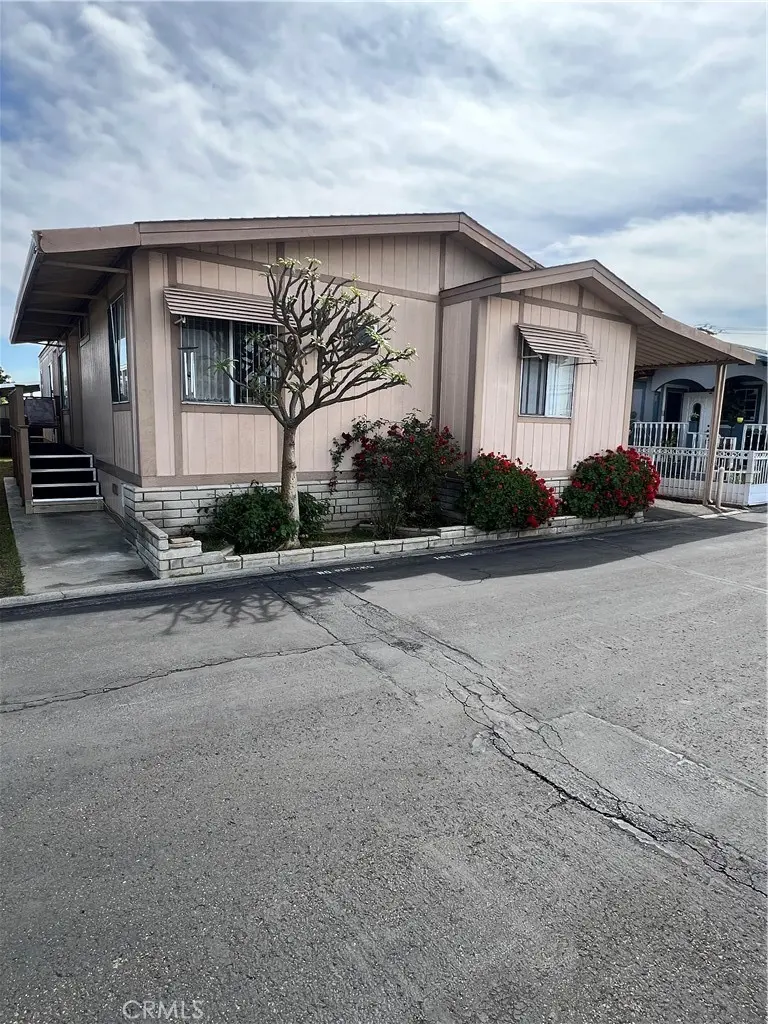
16707 Garfield Ave #2008
Paramount, CA 90723
$159,900B
3 bd · 2.0 ba ·
1,324 sqft ·
Built 1990
· Manufactured
· Active
· 17 DOM
Cashflow @ list (25.0% down · 7.5%)
Estimated rent
$3,156/mo
Mortgage (P&I)
−$839
Tax + insurance
−$116
HOA
−$0
Vac / Maint / Mgmt
−$663
Net cashflow
$1,539/mo
Annual
$18,468/yr
Cap rate
17.84%
Cash-on-cash
41.25%
DSCR
2.84
1% rule
1.97%
Cash to close
$44,772
Investor read
- This is a 3-bed/2.0-bath manufactured listed at $160k. Condition is rated fair.
- At list price, monthly cash flow is $2k ($18k/yr) — positive.
- The deal already cash-flows at list — no discount required.
- Meets the 1% rule at list price ($3k rent vs $160k).
- It's been on market 17 days — a 2% lower offer ($158k) is reasonable based on typical stale-listing flexibility.
- Recommended offer: $158k (1.5% below list) — sets the bar for market timing.
- Local home prices are declining (-3.0%/yr); year-one equity from $1k of loan paydown is wiped out by about $5k of value loss. Plan a longer hold.
- Location reads 64/100 on livability (#432 in CA) — a middle-class / working-renter tenant base. Strengths: commute A+; Watch: schools D, crime F, amenities F.
- Paramount Unified (suburban): math 15% / reading 34% proficiency, ranked #416 of 517 in CA (top 80%) — low school quality limits family demand, transient renter base, plan for 1-2y turnover; 76% free/reduced lunch — lower-income household profile, screen leases tightly.
- Market conditions: Rents soft (-1.0%/yr); 51 active listings in the ZIP; 19 comparable units currently listed for rent nearby; rentals at typical pace (median 25d on market — plan ~3-4 weeks tenant-placement turnaround); solid renter incomes; 19,697 units permitted in Los Angeles County in 2024 (9,426 in 5+ unit buildings).
- Los Angeles County population projected at +9% by 2050 — modest demand growth; plan on rents tracking national, not racing it.
- At projected returns (-3.0% appreciation + 0.0% rent growth), your $45k cash investment doubles in ~3 years — after that, you're playing with house money.
- Climate carrying-cost: moderate flood risk — expect insurance premiums to compound above CPI over the hold.
- Cap rate 17.8% vs local median 3.2% in Paramount — top-decile yield for the area; either an underpriced asset or a hidden risk that comps aren't pricing in. Stress-test before assuming the spread holds.
- At $3,156/mo this rent would consume 50% of the median local household income ($75k/yr) (locally 2420% of renters already pay >50% of income on rent) — very limited rent-growth headroom before tenants either downsize or default.
Questions for listing agent
- Have any recent inspections been done? Can we get a copy of the seller's disclosures and any deferred-maintenance estimates?
- Is there a deadline driving the sale (1031 exchange, divorce, estate, relocation)? That informs how much negotiation room exists.
- Schools are D-rated, which usually means shorter tenancies and higher turnover. Who's the typical renter profile here, and what's been the actual vacancy rate?
- Crime grade is F in this area — have there been break-ins, vandalism, or insurance claims at this property in the last 3 years? What carrier currently insures it and at what premium?
- What's the average days-on-market for RENTAL listings here right now (not sales)? A rising rental-DOM trend means longer vacancies and softer asking-rent achievability than the comps imply.
- What's the recent tenant-quality profile in this submarket — average credit score on applications, eviction rate, late-payment / NSF rate, and stable-employment percentage? A property-management company in the area should have these aggregated.
- How much new for-sale + rental construction is in the pipeline within 1–3 miles? Heavy new supply typically softens prices + rents 12–24 months out; constrained supply supports both.
Repairs flagged (vision-AI assessment)
- Moderate: kitchen cabinets — dated and in need of replacement
- Moderate: bathroom cabinets — dated and in need of replacement
- Moderate: exterior siding — moderate wear
CashFlowRE · CFR-RNGD2G0R2EK182
· Data 2 days ago
cashflowre.app · 2026-05-29