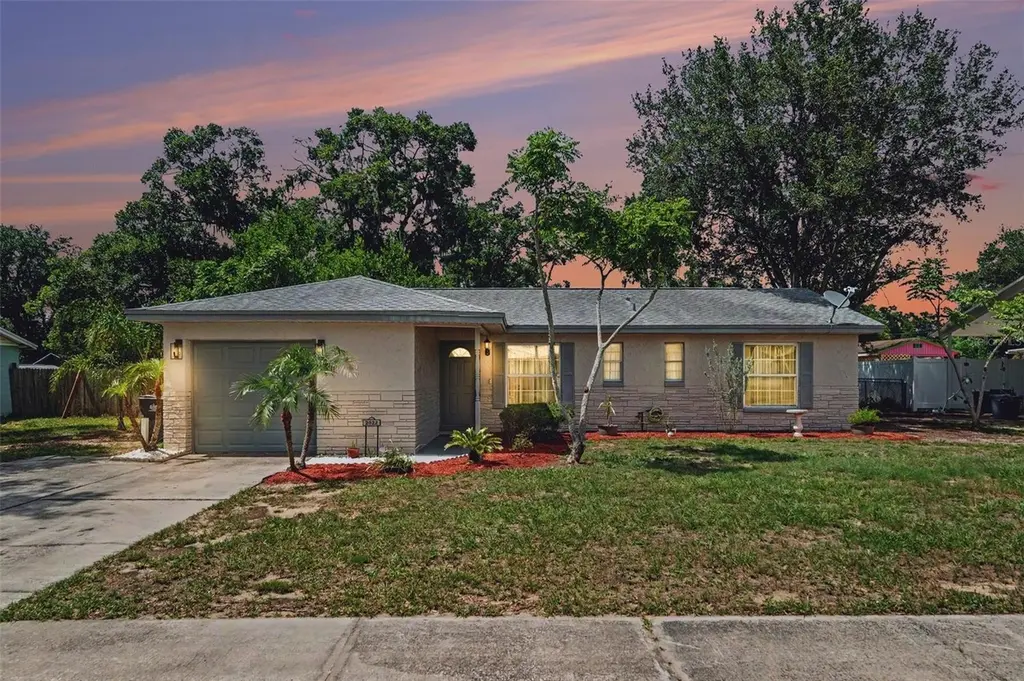
2022 Lance Ct
Brandon, FL 33527
$335,000D-
2 bd · 2.0 ba ·
1,033 sqft ·
Built 1976
· SingleFamily
· Pending
· 3 DOM
Cashflow @ list (25.0% down · 7.5%)
Estimated rent
$2,499/mo
Mortgage (P&I)
−$1,757
Tax + insurance
−$254
HOA
−$0
Vac / Maint / Mgmt
−$525
Net cashflow
$-36/mo
Annual
$-430/yr
Cap rate
6.16%
Cash-on-cash
-0.46%
DSCR
0.98
1% rule
0.75%
Cash to close
$93,800
Investor read
- This is a 2-bed/2.0-bath single-family listed at $335k.
- At list price, monthly cash flow is $-36 ($-430/yr) — negative.
- To cash-flow at today's rent, offer at most $329k (1.9% below list).
- To meet the 1% rule (rent ≥ 1% of price), the offer needs to be $250k (25.4% below list).
- Only 3 days on market — expect competitive offers; lowballing is unlikely to land.
- Recommended offer: $250k (25.4% below list) — sets the bar for 1% rule.
- Local home prices are declining (-3.0%/yr); year-one equity from $2k of loan paydown is wiped out by about $10k of value loss. Plan a longer hold.
- Location reads 85/100 on livability (#26 in FL, #507 nationally) — a professional / high-income tenant draw. Strengths: amenities A+, housing A+, health & safety A+.
- Hillsborough (suburban): math 47% / reading 50% proficiency, ranked #41 of 73 in FL (top 56%) — families likely to look elsewhere, expect single-tenant / working-renter base with shorter leases.
- Zoned schools: Brandon High School (math 32% / reading 36%, grade F, #394 of 667 statewide, top 60%, 1,560 students, 57% FRL).
- Zoned-school proficiency averages 34% at this address vs 48% district-wide (-14 pts) — the specific schools serving this property underperform the Hillsborough average; the district grade overstates school quality for this exact location.
- Market conditions: 68 active listings in the ZIP; 2 comparable units currently listed for rent nearby; solid renter incomes; 9,053 units permitted in Hillsborough County in 2024 (4,555 in 5+ unit buildings).
- Hillsborough County population projected at +37% by 2050 — long-run rental-demand tailwind backs the buy-and-hold thesis.
- Climate carrying-cost: severe wind risk, 99% chance of damaging wind over 30y; extreme-heat days projected 7→25/yr by 2055 (HVAC capex compounding) — expect insurance premiums to compound above CPI over the hold.
- This rent runs 37% of the median local income ($80k/yr) — at the standard rent-burdened threshold; future hikes will face affordability resistance.
Questions for listing agent
- What do current leases actually rent for vs. the listed asking? Can we see a recent rent roll and the last 12 months of T-12 income?
- Built in 1976 — when were the roof, HVAC, electrical panel, plumbing, and water heater last replaced?
- Is there a deadline driving the sale (1031 exchange, divorce, estate, relocation)? That informs how much negotiation room exists.
- The area grade is low — what's the realistic commute time and amenity access for the typical tenant pool here? Any planned neighborhood developments (good or bad) we should know about?
- What's the average days-on-market for RENTAL listings here right now (not sales)? A rising rental-DOM trend means longer vacancies and softer asking-rent achievability than the comps imply.
- What's the recent tenant-quality profile in this submarket — average credit score on applications, eviction rate, late-payment / NSF rate, and stable-employment percentage? A property-management company in the area should have these aggregated.
- How much new for-sale + rental construction is in the pipeline within 1–3 miles? Heavy new supply typically softens prices + rents 12–24 months out; constrained supply supports both.
CashFlowRE · CFR-RQ2WF48D89M9RR
· Data 1 week ago
cashflowre.app · 2026-05-29