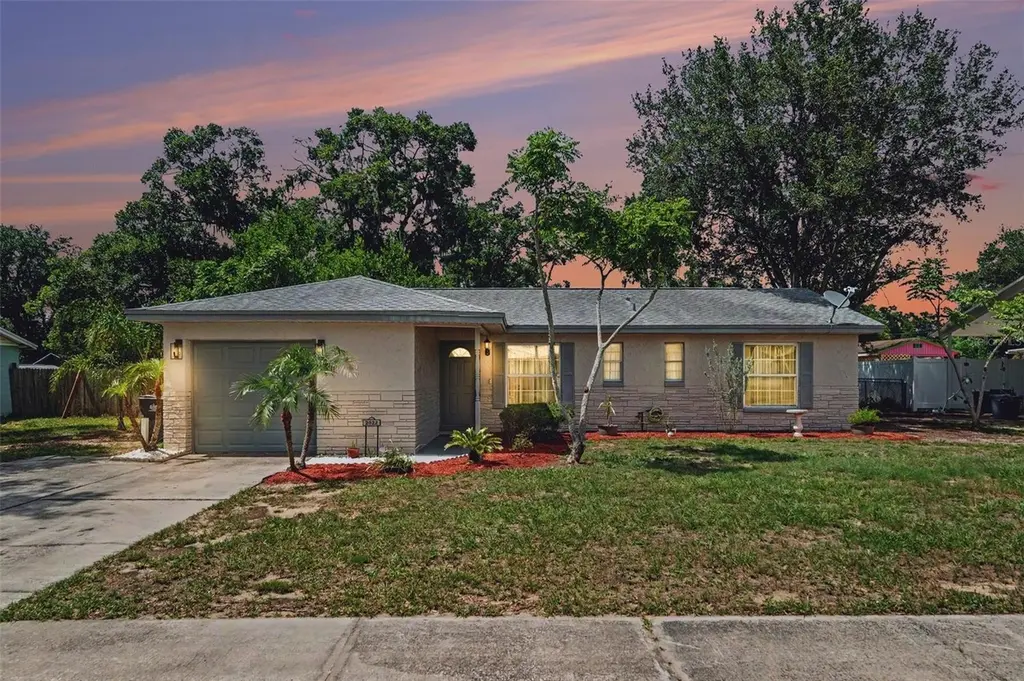
2022 Lance Ct · Brandon, FL
Flood risk 1/10 · Minimal
- FEMA flood zone
- X (unshaded)
- Chance of flooding over 30 yrs
- 0.0%
- Est. flood insurance / yr
- $507 – $1,088
Fire risk 3/10 · Minor
- Est. fire insurance / yr
- $947 – $1,759
Heat risk 10/10 · Severe
- Hot days now (above 110°F)
- 7 days/yr
- Hot days in 30 yrs
- 25 days/yr
Wind risk 9/10 · Severe
- Chance of severe wind over 30 yrs
- 99.0%
Air-quality risk 4/10 · Minor
- Unhealthy air days now
- 4 days/yr
- Unhealthy air days in 30 yrs
- 4 days/yr
Risk factors via First Street. Map © Google.
Why this score? — see what drove the D- grade
The composite is a weighted blend of 9 inputs, each scored 0–100. Each bar is that input's sub-score; the figure is the points it added to the 100-point composite (weight × sub-score).
- Cash flow +12.7/30.0
- ARV discount +7.5/15.0
- Schools +4.2/10.0
- Livability +4.2/5.0
- DSCR +3.8/10.0
- 1% rule +2.5/10.0
- Rent growth +2.5/5.0
- Condition / age +2.5/5.0
- Appreciation +0.0/10.0
$335,000
🖨 Deal sheet 📄 Offer letter ✓ Due diligence
Listing remarks
Under contract-accepting backup offers. Beautiful Pool Home with No HOA or CDD Fees! Conveniently located just off Valrico Road with a Dover mailing address, yet moments from Seffner and Valrico. This well-maintained home features fresh interior paint, a Spacious Living and Dining Room combination, and beautiful views overlooking the Screened Lanai and Inground Pool — Perfect for Relaxing or Entertaining. Offering 3 bedrooms and 2 bathrooms, Major Updates include a Roof replaced in 2020, AC replaced in 2017, double-pane windows, and the home was fully replumbed this year. The septic system and drainfield were also replaced within the past few years for added peace of mind. The kitchen
Key facts
- Ac replaced
- No cdd fees
- Screened lanai
Tags
Property features AI
Finance
- Other: Property type: Residential - Single Family Residence; Zoning: RSC-6; Lot is landscaped, level, paved, and in county; Private in-ground gunite pool with screen enclosure and spa
- Financial info: Homestead exempt
- HOA & community: No HOA/association; Pets allowed
Exterior
- Parking: Attached garage (1 car)
- Security: Smoke detectors
- Utilities: Public water; Septic tank sewer; Electricity connected; Cable available
- Home design: Single-family residence; One story; Faces south; Completed condition
- Construction: Block and vinyl siding construction; Shingle roof; Block foundation; Built on a 0.26-acre lot (approximately 82x140)
- Exterior features: Enclosed screened front porch; Screened patio/porch; Sliding doors; Sidewalk; Chain link and wood fencing; Mature landscaping with trees
Interior
- Kitchen: Dishwasher; Range; Refrigerator; Electric water heater
- Bedrooms: 3 bedrooms
- Flooring: Ceramic tile; Laminate
- Bathrooms: 2 full bathrooms
- Heating & cooling: Central heating (electric); Central air conditioning
- Interior features: Ceiling fans; Living room/dining room combo; Blinds; Double-pane windows; Attic
- Laundry & utility: Washer; Dryer; Laundry area in garage
Neighborhood map
What this means for you Summary
Snapshot
- This is a 2-bed/2.0-bath single-family listed at $335k.
Deal economics
- At list price, monthly cash flow is $-36 ($-430/yr) — negative.
- To cash-flow at today's rent, offer at most $329k (1.9% below list).
- To meet the 1% rule (rent ≥ 1% of price), the offer needs to be $250k (25.4% below list).
- Recommended offer: $250k (25.4% below list) — sets the bar for 1% rule.
Location & tenants
- Location reads 85/100 on livability (#26 in FL, #507 nationally) — a professional / high-income tenant draw. Strengths: amenities A+, housing A+, health & safety A+.
- Hillsborough (suburban): math 47% / reading 50% proficiency, ranked #41 of 73 in FL (top 56%) — families likely to look elsewhere, expect single-tenant / working-renter base with shorter leases.
- Zoned schools: Brandon High School (math 32% / reading 36%, grade F, #394 of 667 statewide, top 60%, 1,560 students, 57% FRL).
- Zoned-school proficiency averages 34% at this address vs 48% district-wide (-14 pts) — the specific schools serving this property underperform the Hillsborough average; the district grade overstates school quality for this exact location.
- Market conditions: 68 active listings in the ZIP; 2 comparable units currently listed for rent nearby; solid renter incomes; 9,053 units permitted in Hillsborough County in 2024 (4,555 in 5+ unit buildings).
- This rent runs 37% of the median local income ($80k/yr) — at the standard rent-burdened threshold; future hikes will face affordability resistance.
Forward outlook
- Local home prices are declining (-3.0%/yr); year-one equity from $2k of loan paydown is wiped out by about $10k of value loss. Plan a longer hold.
- Hillsborough County population projected at +37% by 2050 — long-run rental-demand tailwind backs the buy-and-hold thesis.
Negotiation context
- Only 3 days on market — expect competitive offers; lowballing is unlikely to land.
Risks & watch-outs
- Climate carrying-cost: severe wind risk, 99% chance of damaging wind over 30y; extreme-heat days projected 7→25/yr by 2055 (HVAC capex compounding) — expect insurance premiums to compound above CPI over the hold.
Questions for the listing agent
- What do current leases actually rent for vs. the listed asking? Can we see a recent rent roll and the last 12 months of T-12 income?
- Built in 1976 — when were the roof, HVAC, electrical panel, plumbing, and water heater last replaced?
- Is there a deadline driving the sale (1031 exchange, divorce, estate, relocation)? That informs how much negotiation room exists.
- The area grade is low — what's the realistic commute time and amenity access for the typical tenant pool here? Any planned neighborhood developments (good or bad) we should know about?
- What's the average days-on-market for RENTAL listings here right now (not sales)? A rising rental-DOM trend means longer vacancies and softer asking-rent achievability than the comps imply.
- What's the recent tenant-quality profile in this submarket — average credit score on applications, eviction rate, late-payment / NSF rate, and stable-employment percentage? A property-management company in the area should have these aggregated.
- How much new for-sale + rental construction is in the pipeline within 1–3 miles? Heavy new supply typically softens prices + rents 12–24 months out; constrained supply supports both.
Investment metrics
- 1% rule
- 0.75% ✗
- Cap rate
- 6.16%
- Cash-on-cash
- -0.46%
- DSCR
- 0.98
- GRM
- 11.2
CMA / ARV
No comps found within radius.
Projected returns pro-forma
-3.0% appreciation · 3.0% rent growth · sell at horizon
- IRR
- -17.1%
- Equity multiple
- 0.40×
- Total profit
- $-56,716
- Equity at exit
- $49,950
- IRR
- -9.1%
- Equity multiple
- 0.44×
- Total profit
- $-52,934
- Equity at exit
- $28,965
Cash invested: $93,800 (down + closing). Projections, not guarantees.
Landlord ↔ Tenant lean methodology
- Overall (STATE)
- 87 Strongly Landlord-Friendly
- State Florida
- 87 Strongly Landlord-Friendly · R+3
- County
- — inherits STATE
- City
- — inherits STATE
ZIP-level market 33527
- Home prices YoY
- -17.6%
- Active inventory
- 68
- Price-to-rent
- 11.2×
Monthly cashflow live
- Estimated rent
- $2,499 medium interval (Pro) →
- Mortgage (P&I)
- −$1,757
- Tax from tax record
- −$114 /mo · $1,368/yr
- Insurance
- −$140
- HOA
- −$0
- Vacancy / Maint / Mgmt
- −$525
- Net cashflow
- $-36
Break-even live
UW: 25.0% down · 7.5% · 30yr · 1.5% tax · 5.0% vac · 8.0% maint · 8.0% mgmt
Financing live
Cash to close
- Down payment
- $83,750
- Closing costs
- $10,050
- Reserves months
- —
- Total cash needed
- —
Loan-product check · same deal, 3 products live
Conventional
25% down · 7.5% · 30yr
- Down + closing
- —
- Monthly P&I
- —
- Monthly cashflow
- —
- DSCR
- —
- Eligible?
- —
Personal DTI + credit; lowest rate.
DSCR
20% down · 8.5% · 30yr
- Down + closing
- —
- Monthly P&I
- —
- Monthly cashflow
- —
- DSCR
- —
- Eligible?
- —
No personal income docs; deal must DSCR.
Hard money
10% down · 12.0% · 12mo
- Down + closing
- —
- Monthly P&I
- —
- Monthly cashflow
- —
- DSCR
- —
- Eligible?
- —
Short-term bridge; refi at stabilization.
Rent comps 2 comps
| Address | Beds | Baths | Sqft | Rent | $/sqft | DOM | Units | Dist |
|---|---|---|---|---|---|---|---|---|
| 1022 Harvest Moon Dr Seffner, FL | 3.0 | 2.0 | 1179 | $2,020 | $1.71 | 1d | 1 | 0.86mi |
| 1023 Malletwood Dr Brandon, FL | 3.0 | 2.0 | 1490 | $2,285 | $1.53 | 2d | 1 | 1.48mi |
Listing history 5 events
-
2026-06-07status $335,000 Pending 3 DOM
-
2026-06-04days on market $335,000 Active 3 DOM
-
2026-06-03days on market $335,000 Active 2 DOM
-
2026-06-01remarks 693-char remark
-
2026-06-01$335,000 Active 1 DOM
ⓘ Source: listings_history table (triggers on properties + properties_extension) + one-shot
backfill from property_details.listing_events for pre-trigger history.
Tax reassessment forecast FL · Resets to sale price
- Current annual tax
- $1,368 · $114/mo
- Projected year-2 tax
- $2,780 · $232/mo
- Expected delta
- +$1,413/yr (+$118/mo · 103.3%)
ⓘ Screening estimate from a state-policy table — verify with the county assessor before closing.
Climate risk First Street
- Flood 1/10 Low FEMA zone X (unshaded) · 0% chance over 30 yrs
- Wildfire 3/10 Moderate
- Heat 10/10 Extreme 7 d/yr ≥110°F today · 25 d/yr by 30 yrs out
- Wind 9/10 Extreme 99% chance of damaging wind over 30 yrs
- Air quality 4/10 Moderate 4 unhealthy d/yr today · 4 by 30 yrs out
Nearby sold comps map
Loading sold comps map…
Walkable amenities ~0.75 mi
Loading nearby amenities…
Taxation est. · year 1
- Rental income
- $29,992
- − Mortgage interest
- −$18,765
- − Property taxes
- −$1,368
- − Insurance
- −$1,675
- − Repairs & maintenance
- −$2,399
- − Management
- −$2,399
- − Depreciation
- −$9,745
- Taxable loss
- −$6,360
- Est. tax savings @ 24.0%
- +$1,526
- After-tax cash flow
- $1,096/yr
For passive investors: Depreciation is non-cash, so a rental often shows a tax loss while cash-flowing — sheltering income. Rental losses are passive: they offset passive income freely, and up to $25,000/yr can offset ordinary (W-2) income if you actively participate and your MAGI is under $100k (phasing out to $0 by $150k); unused losses carry forward. On sale, claimed depreciation is recaptured at up to 25%, and gains may owe capital-gains tax (a 1031 exchange can defer both). Figures are a year-1 estimate at your 24.0% rate — not tax advice; consult a CPA.
Schools (NCES district)
- District
- Hillsborough
- NCES district ID
- 1200870
- Math proficiency
- 47% ▼ -8.00%
- Reading proficiency
- 50% ▼ -4.00%
- Median HH income
- $50,622
- Composite
- 41.6/100
- National rank
- #3435
- State rank
- #41 of 73 in FL
Livability — Brandon
- Score
- 85/100
- State rank
- #26
- US rank
- #507
Category grades
Schools grade is shown separately in the Schools card above.
Census & demographics
- Census place
- Brandon, FL
- County
- Hillsborough County · 1,540,968 people
- City population
- 92,716
- Metro
- Tampa-St. Petersburg-Clearwater, FL
- Population (ZIP)
- 17,364
- Household income
- $80,464
- Rent vs Own
- Severe rent burden
- 433.0
Population outlook (Hillsborough County) Hauer SSP2
- Today (2025)
- 1,607,022 people
- By 2030
- 1,733,968 · +7.9%
- By 2040
- 1,979,565 · +23.2%
- By 2050
- 2,203,427 · +37.1%
- By 2075
- 2,667,893 · +66.0%
- By 2100
- 2,891,558 · +79.9%
Race, ethnicity, and origin ACS 2023
- Neighborhood character
- Diverse neighborhood (Simpson 0.58)
- Race & ethnicity
- White 55% Hispanic / Latino 34% Two or more races 12% Black 6% Asian 2%
- Hispanic origin (detail)
- Mexican 26% Puerto Rican 3% Cuban 1%
- Common ancestry
- Slovak 3% Lithuanian 2% Italian 1%
- Foreign-born
- 18% · Canada
- Languages at home
- 70% English-only · Spanish 26% Other Asian/Pacific 1% Other Indo-European 1%
Political lean MEDSL · Hillsborough
- 2024 margin
- Toss-up / Even · D 47.8% · R 50.9% · Other 1.3%
- 2008→2024 swing
- -10.2pp toward R · 2008: 7.1pp · 2024: -3.1pp
- All cycles
- 2024: R+3.1 2020: D+6.9 2016: D+6.8 2012: D+6.7 2008: D+7.1
Not yet ingested
- Civics
- —
Market trends
- HPI YoY
- ▼ -69.50%
- Current HPI
- 324.2363
- Rent YoY
- —
- Metro
- Tampa-St. Petersburg-Clearwater, FL
- State GDP YoY
- ▲ 3.28%
- F500 in state
- 36
Industry mix (Fortune 500 HQ in FL)
| Industry | F500 HQs | Revenue |
|---|---|---|
| Industrial Technology | 2 | $29B |
|
||
| Insurance | 2 | $17B |
|
||
| Retail | 1 | $60B |
|
||
| Technology Distribution | 1 | $58B |
|
||
| Homebuilding | 1 | $35B |
|
||
| Technology Manufacturing | 1 | $35B |
|
||
Price history
1 event — show timeline
- 2026-06-01 Listed $335,000 Stellar MLS as Distributed by MLS Grid
Property tax history
+3.6%/yrLatest (2025): $1,368 · +11.1% YoY. Source: county tax records.
Cash-flow waterfall
monthlySold comps — $/sqft
last 12 mo · ≤1 miLoading sold comps…