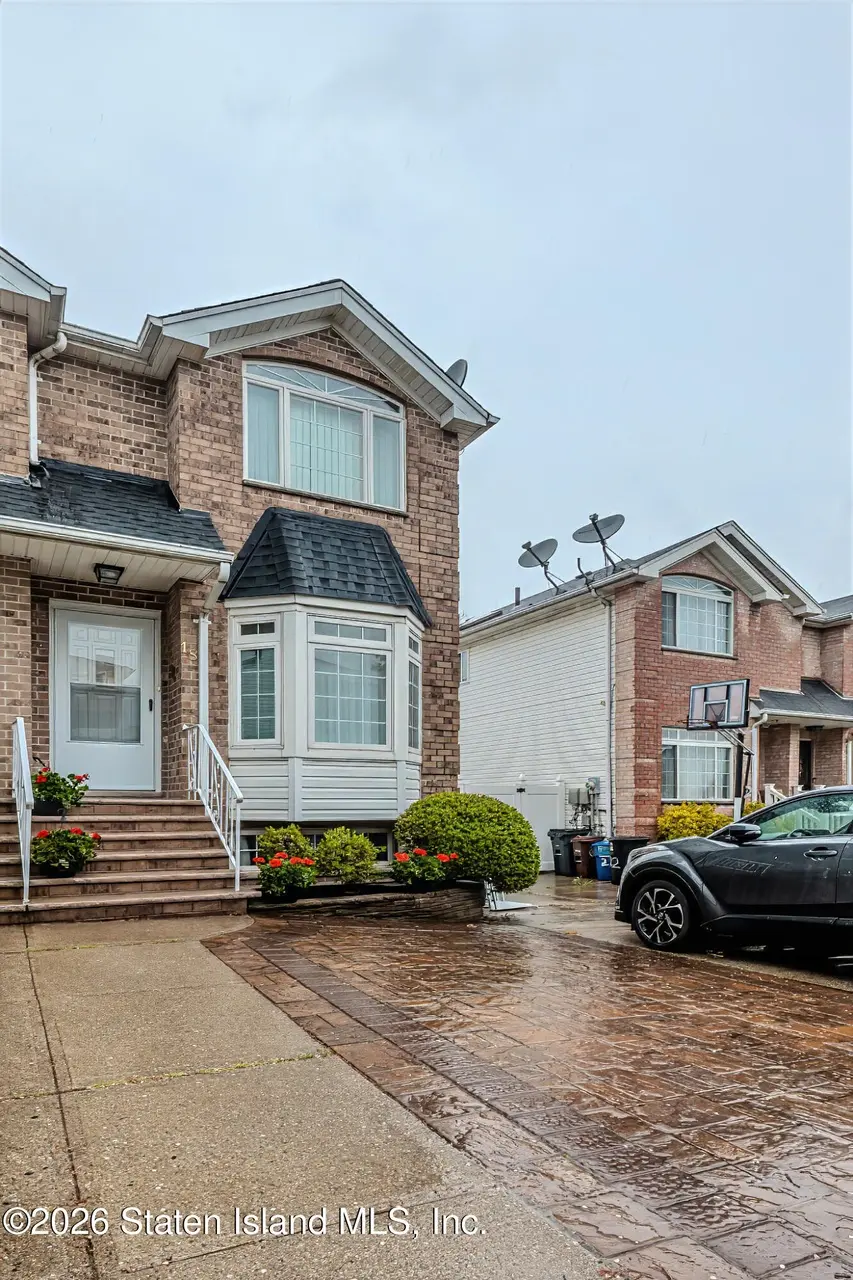
18 Bellavista Ct
New York, NY 10305
$890,000F
6 bd · 8.0 ba ·
1,656 sqft ·
Built 1998
· MultiFamily
· Pending
· 13 DOM
Cashflow @ list (25.0% down · 7.5%)
Estimated rent
$5,860/mo
Mortgage (P&I)
−$4,667
Tax + insurance
−$979
HOA
−$0
Vac / Maint / Mgmt
−$1,231
Net cashflow
$-1,017/mo
Annual
$-12,208/yr
Cap rate
4.92%
Cash-on-cash
-4.90%
DSCR
0.78
1% rule
0.66%
Cash to close
$249,200
Investor read
- This is a 2 × 2-bed/2.5-bath units multifamily listed at $890k.
- At list price, monthly cash flow is $-1k ($-12k/yr) — negative. Per door: $-509/mo.
- To cash-flow at today's rent, offer at most $710k (20.2% below list).
- To meet the 1% rule (rent ≥ 1% of price), the offer needs to be $586k (34.2% below list).
- Only 13 days on market — expect competitive offers; lowballing is unlikely to land.
- Recommended offer: $586k (34.2% below list) — sets the bar for 1% rule.
- Local home prices are declining (-3.0%/yr); year-one equity from $6k of loan paydown is wiped out by about $27k of value loss. Plan a longer hold.
- Location reads 75/100 on livability (#268 in NY, #4,188 nationally) — a middle-class / working-renter tenant base. Strengths: amenities A+, commute A+, health & safety A; Watch: crime F, cost of living F.
- Market conditions: Rents rising fast (+7.5%/yr); 254 active listings in the ZIP; solid renter incomes; 480 units permitted in Richmond County in 2024 (22 in 5+ unit buildings).
- Richmond County population projected to shrink 5% by 2050 — rents likely to lag national; underwrite the cash flow, not the appreciation.
- 2 sale attempts since 19y ago with the ask held roughly flat each time — persistent listings suggest the price (not the market) is what's stuck; bring a comps-based counter.
- Current owner paid $528k; list at $890k implies a 69% gain — meaningful room to come down on a strong offer.
- Climate carrying-cost: major wind risk, 62% chance of damaging wind over 30y; extreme-heat days projected 7→16/yr by 2055 (HVAC capex compounding) — expect insurance premiums to compound above CPI over the hold.
- Cap rate 4.9% vs local median 2.6% in New York — top-decile yield for the area; either an underpriced asset or a hidden risk that comps aren't pricing in. Stress-test before assuming the spread holds.
- At $5,860/mo this rent would consume 84% of the median local household income ($83k/yr) (locally 1647% of renters already pay >50% of income on rent) — very limited rent-growth headroom before tenants either downsize or default.
Questions for listing agent
- What do current leases actually rent for vs. the listed asking? Can we see a recent rent roll and the last 12 months of T-12 income?
- Can we see the unit-by-unit rent roll, current vacancy, and any below-market leases? What's the average tenancy length?
- What capital expenditures (roof, boiler, parking lot, exteriors) have been made in the last 5 years, and what's planned in the next 2?
- Is there a deadline driving the sale (1031 exchange, divorce, estate, relocation)? That informs how much negotiation room exists.
- Schools are B-rated — typically a magnet for longer-tenancy family renters. What's the average tenant stay here, and is there a school-zone premium baked into asking?
- Crime grade is F in this area — have there been break-ins, vandalism, or insurance claims at this property in the last 3 years? What carrier currently insures it and at what premium?
- The area grade is low — what's the realistic commute time and amenity access for the typical tenant pool here? Any planned neighborhood developments (good or bad) we should know about?
- What's the average days-on-market for RENTAL listings here right now (not sales)? A rising rental-DOM trend means longer vacancies and softer asking-rent achievability than the comps imply.
CashFlowRE · CFR-RQBA1Z9Z133CK8
· Data 4 days ago
cashflowre.app · 2026-05-29