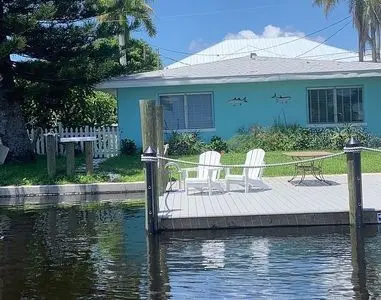
2609 Bridgeview St
Matlacha, FL 33993
$449,500D+
4 bd · 4.0 ba ·
1,120 sqft ·
Built 1959
· Other
· Active
· 4 DOM
Cashflow @ list (25.0% down · 7.5%)
Estimated rent
$4,413/mo
Mortgage (P&I)
−$2,357
Tax + insurance
−$1,176
HOA
−$0
Vac / Maint / Mgmt
−$927
Net cashflow
$-47/mo
Annual
$-563/yr
Cap rate
7.31%
Cash-on-cash
3.62%
DSCR
1.16
1% rule
0.98%
Cash to close
$125,860
Investor read
- This is a 4-bed/4.0-bath other listed at $450k. Condition is rated good.
- At list price, monthly cash flow is $-47 ($-563/yr) — negative.
- To cash-flow at today's rent, offer at most $443k (1.5% below list).
- To meet the 1% rule (rent ≥ 1% of price), the offer needs to be $441k (1.8% below list).
- Only 4 days on market — expect competitive offers; lowballing is unlikely to land.
- Recommended offer: $441k (1.8% below list) — sets the bar for 1% rule.
- Local home prices are declining (-3.0%/yr); year-one equity from $3k of loan paydown is wiped out by about $13k of value loss. Plan a longer hold.
- Location reads 59/100 on livability (#824 in FL) — a working-class tenant base; expect higher turnover. Strengths: crime A+; Watch: amenities F, commute F, health & safety D-.
- Watch-outs: flood insurance adds $427/mo; built in 1959 — expect roof / HVAC / electrical / plumbing capex.
- Market conditions: Rents falling (-5.5%/yr); 2652 active listings in the ZIP; 2 comparable units currently listed for rent nearby; solid renter incomes; 15,411 units permitted in Lee County in 2024 (4,686 in 5+ unit buildings).
- Lee County population projected at +44% by 2050 — long-run rental-demand tailwind backs the buy-and-hold thesis.
- Climate carrying-cost: in FEMA flood zone AE (mandatory federal flood insurance); severe wind risk, 99% chance of damaging wind over 30y; extreme-heat days projected 7→28/yr by 2055 (HVAC capex compounding) — expect insurance premiums to compound above CPI over the hold.
- At $4,413/mo this rent would consume 58% of the median local household income ($91k/yr) (locally 286% of renters already pay >50% of income on rent) — very limited rent-growth headroom before tenants either downsize or default.
Questions for listing agent
- What do current leases actually rent for vs. the listed asking? Can we see a recent rent roll and the last 12 months of T-12 income?
- Built in 1959 — when were the roof, HVAC, electrical panel, plumbing, and water heater last replaced?
- What's the actual annual flood-insurance premium (NFIP or private), and is the property in a SFHA with mandatory coverage?
- Is there a deadline driving the sale (1031 exchange, divorce, estate, relocation)? That informs how much negotiation room exists.
- The area grade is low — what's the realistic commute time and amenity access for the typical tenant pool here? Any planned neighborhood developments (good or bad) we should know about?
- What's the average days-on-market for RENTAL listings here right now (not sales)? A rising rental-DOM trend means longer vacancies and softer asking-rent achievability than the comps imply.
- What's the recent tenant-quality profile in this submarket — average credit score on applications, eviction rate, late-payment / NSF rate, and stable-employment percentage? A property-management company in the area should have these aggregated.
- How much new for-sale + rental construction is in the pipeline within 1–3 miles? Heavy new supply typically softens prices + rents 12–24 months out; constrained supply supports both.
CashFlowRE · CFR-RQPFGK386EDMS4
· Data 3 days ago
cashflowre.app · 2026-05-29