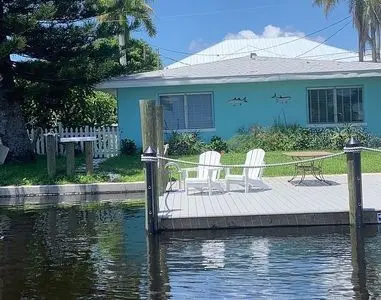
2609 Bridgeview St · Matlacha, FL
Flood risk 10/10 · Severe
- FEMA flood zone
- AE
- Chance of flooding over 30 yrs
- 0.99%
- Est. flood insurance / yr
- $1,737 – $8,500
Fire risk 3/10 · Minor
- Est. fire insurance / yr
- $947 – $1,759
Heat risk 10/10 · Severe
- Hot days now (above 107°F)
- 7 days/yr
- Hot days in 30 yrs
- 28 days/yr
Wind risk 10/10 · Severe
- Chance of severe wind over 30 yrs
- 99.0%
Air-quality risk 2/10 · Minimal
- Unhealthy air days now
- 1 days/yr
- Unhealthy air days in 30 yrs
- 1 days/yr
Risk factors via First Street. Map © Google.
Why this score? — see what drove the D+ grade
The composite is a weighted blend of 9 inputs, each scored 0–100. Each bar is that input's sub-score; the figure is the points it added to the 100-point composite (weight × sub-score).
- Cash flow +17.9/30.0
- ARV discount +7.5/15.0
- DSCR +5.6/10.0
- Schools +5.0/10.0
- 1% rule +4.8/10.0
- Condition / age +3.8/5.0
- Livability +3.0/5.0
- Rent growth +1.1/5.0
- Appreciation +0.0/10.0
$449,500
🖨 Deal sheet 📄 Offer letter ✓ Due diligence
Listing remarks
Duplex on Matlacha. * Must contact me to arrange viewing * It is currently rented and no sign on property. Each side one bedroom one bath full kitchen. Large dock on a direct access canal to Gulf and Matlacha Pass/Charlotte Harbor. Currently listed on AirBNB as short term rental. Interior photos are just one side but other side is similar. New metal roof in 2023. Terazzo floors throughout. Granite counters. Stainless steel appliances.
Key facts
- New metal roof
- Large dock
- Direct access canal
Tags
Neighborhood map
What this means for you Summary
Snapshot
- This is a 4-bed/4.0-bath other listed at $450k. Condition is rated good.
Deal economics
- At list price, monthly cash flow is $-47 ($-563/yr) — negative.
- To cash-flow at today's rent, offer at most $443k (1.5% below list).
- To meet the 1% rule (rent ≥ 1% of price), the offer needs to be $441k (1.8% below list).
- Recommended offer: $441k (1.8% below list) — sets the bar for 1% rule.
Location & tenants
- Location reads 59/100 on livability (#824 in FL) — a working-class tenant base; expect higher turnover. Strengths: crime A+; Watch: amenities F, commute F, health & safety D-.
- Market conditions: Rents falling (-5.5%/yr); 2652 active listings in the ZIP; 2 comparable units currently listed for rent nearby; solid renter incomes; 15,411 units permitted in Lee County in 2024 (4,686 in 5+ unit buildings).
- At $4,413/mo this rent would consume 58% of the median local household income ($91k/yr) (locally 286% of renters already pay >50% of income on rent) — very limited rent-growth headroom before tenants either downsize or default.
Forward outlook
- Local home prices are declining (-3.0%/yr); year-one equity from $3k of loan paydown is wiped out by about $13k of value loss. Plan a longer hold.
- Lee County population projected at +44% by 2050 — long-run rental-demand tailwind backs the buy-and-hold thesis.
Negotiation context
- Only 4 days on market — expect competitive offers; lowballing is unlikely to land.
Risks & watch-outs
- Watch-outs: flood insurance adds $427/mo; built in 1959 — expect roof / HVAC / electrical / plumbing capex.
- Climate carrying-cost: in FEMA flood zone AE (mandatory federal flood insurance); severe wind risk, 99% chance of damaging wind over 30y; extreme-heat days projected 7→28/yr by 2055 (HVAC capex compounding) — expect insurance premiums to compound above CPI over the hold.
Questions for the listing agent
- What do current leases actually rent for vs. the listed asking? Can we see a recent rent roll and the last 12 months of T-12 income?
- Built in 1959 — when were the roof, HVAC, electrical panel, plumbing, and water heater last replaced?
- What's the actual annual flood-insurance premium (NFIP or private), and is the property in a SFHA with mandatory coverage?
- Is there a deadline driving the sale (1031 exchange, divorce, estate, relocation)? That informs how much negotiation room exists.
- The area grade is low — what's the realistic commute time and amenity access for the typical tenant pool here? Any planned neighborhood developments (good or bad) we should know about?
- What's the average days-on-market for RENTAL listings here right now (not sales)? A rising rental-DOM trend means longer vacancies and softer asking-rent achievability than the comps imply.
- What's the recent tenant-quality profile in this submarket — average credit score on applications, eviction rate, late-payment / NSF rate, and stable-employment percentage? A property-management company in the area should have these aggregated.
- How much new for-sale + rental construction is in the pipeline within 1–3 miles? Heavy new supply typically softens prices + rents 12–24 months out; constrained supply supports both.
Investment metrics
- 1% rule
- 0.98% ✗
- Cap rate
- 7.31%
- Cash-on-cash
- 3.62%
- DSCR
- 1.16
- GRM
- 8.5
CMA / ARV
No comps found within radius.
Projected returns pro-forma
-3.0% appreciation · 0.0% rent growth · sell at horizon
- IRR
- -20.9%
- Equity multiple
- 0.30×
- Total profit
- $-88,427
- Equity at exit
- $67,022
- IRR
- -24.8%
- Equity multiple
- -0.03×
- Total profit
- $-129,487
- Equity at exit
- $38,865
Cash invested: $125,860 (down + closing). Projections, not guarantees.
Landlord ↔ Tenant lean methodology
- Overall (STATE)
- 87 Strongly Landlord-Friendly
- State Florida
- 87 Strongly Landlord-Friendly · R+3
- County
- — inherits STATE
- City
- — inherits STATE
ZIP-level market 33993
- Home prices YoY
- -14.1%
- Rents YoY
- -5.5%
- Active inventory
- 2652
- Price-to-rent
- 8.5×
Monthly cashflow live
- Estimated rent
- $4,413 medium interval (Pro) →
- Mortgage (P&I)
- −$2,357
- Tax est. 1.5%
- −$562 /mo · $6,742/yr
- Insurance
- −$187
- Flood insurance flood zone
- −$427 /mo · $5,118/yr
- HOA
- −$0
- Vacancy / Maint / Mgmt
- −$927
- Net cashflow
- $-47
Break-even live
UW: 25.0% down · 7.5% · 30yr · 1.5% tax · 5.0% vac · 8.0% maint · 8.0% mgmt
Financing live
Cash to close
- Down payment
- $112,375
- Closing costs
- $13,485
- Reserves months
- —
- Total cash needed
- —
Loan-product check · same deal, 3 products live
Conventional
25% down · 7.5% · 30yr
- Down + closing
- —
- Monthly P&I
- —
- Monthly cashflow
- —
- DSCR
- —
- Eligible?
- —
Personal DTI + credit; lowest rate.
DSCR
20% down · 8.5% · 30yr
- Down + closing
- —
- Monthly P&I
- —
- Monthly cashflow
- —
- DSCR
- —
- Eligible?
- —
No personal income docs; deal must DSCR.
Hard money
10% down · 12.0% · 12mo
- Down + closing
- —
- Monthly P&I
- —
- Monthly cashflow
- —
- DSCR
- —
- Eligible?
- —
Short-term bridge; refi at stabilization.
Rent comps 2 comps
| Address | Beds | Baths | Sqft | Rent | $/sqft | DOM | Units | Dist |
|---|---|---|---|---|---|---|---|---|
| 2758 Bruce St Matlacha, FL | 3.0 | 2.0 | 1404 | $5,500 | $3.92 | 23d | 1 | 0.23mi |
| 2579 3rd St Matlacha, FL | 3.0 | 3.0 | 1402 | $5,500 | $3.92 | 23d | 1 | 0.50mi |
Listing history 4 events
-
2026-06-17days on market $449,500 Active 4 DOM
-
2026-06-16days on market $449,500 Active 3 DOM
-
2026-06-16remarks 443-char remark
-
2026-06-16$449,500 Active 2 DOM
ⓘ Source: listings_history table (triggers on properties + properties_extension) + one-shot
backfill from property_details.listing_events for pre-trigger history.
Climate risk First Street
- Flood 10/10 Extreme FEMA zone AE · 99% chance over 30 yrs
- Wildfire 3/10 Moderate
- Heat 10/10 Extreme 7 d/yr ≥107°F today · 28 d/yr by 30 yrs out
- Wind 10/10 Extreme 99% chance of damaging wind over 30 yrs
- Air quality 2/10 Low 1 unhealthy d/yr today · 1 by 30 yrs out
Nearby sold comps map
Loading sold comps map…
Walkable amenities ~0.75 mi
Loading nearby amenities…
Taxation est. · year 1
- Rental income
- $52,953
- − Mortgage interest
- −$25,179
- − Property taxes
- −$6,742
- − Insurance
- −$7,366
- − Repairs & maintenance
- −$4,236
- − Management
- −$4,236
- − Depreciation
- −$13,076
- Taxable loss
- −$7,884
- Est. tax savings @ 24.0%
- +$1,892
- After-tax cash flow
- $1,330/yr
For passive investors: Depreciation is non-cash, so a rental often shows a tax loss while cash-flowing — sheltering income. Rental losses are passive: they offset passive income freely, and up to $25,000/yr can offset ordinary (W-2) income if you actively participate and your MAGI is under $100k (phasing out to $0 by $150k); unused losses carry forward. On sale, claimed depreciation is recaptured at up to 25%, and gains may owe capital-gains tax (a 1031 exchange can defer both). Figures are a year-1 estimate at your 24.0% rate — not tax advice; consult a CPA.
Condition & rehab AI · 1 photo
This property is in good condition with a new metal roof and well-maintained exterior. It offers a good investment opportunity with potential for cosmetic upgrades to enhance its curb appeal and value.
Value-add opportunities
- Both Paint exterior and interior — Enhances curb appeal and interior aesthetics
- Both Replace dock and railings — Improves safety and enhances curb appeal
- Both Upgrade landscaping — Enhances curb appeal and adds value
Renovation cost estimate screening
Value-add ROI direction
- Both Paint exterior and interior — Enhances curb appeal and interior aesthetics ↑
- Both Replace dock and railings — Improves safety and enhances curb appeal ↑
- Both Upgrade landscaping — Enhances curb appeal and adds value ↑
ⓘ Cost ranges are severity-bucket heuristics (US national rule-of-thumb). Get contractor quotes + a written scope before underwriting a rehab budget.
Schools (NCES district)
No district data.
Livability — Matlacha
- Score
- 59/100
- State rank
- #824
- US rank
- #20183
Category grades
Schools grade is shown separately in the Schools card above.
Census & demographics
- Census place
- Matlacha, FL
- County
- Lee County · 788,662 people
- Metro
- Cape Coral-Fort Myers, FL
- Population (ZIP)
- 35,580
- Household income
- $90,577
- Rent vs Own
- Severe rent burden
- 286.0
Population outlook (Lee County) Hauer SSP2
- Today (2025)
- 871,946 people
- By 2030
- 955,468 · +9.6%
- By 2040
- 1,113,587 · +27.7%
- By 2050
- 1,256,891 · +44.1%
- By 2075
- 1,560,270 · +78.9%
- By 2100
- 1,726,848 · +98.0%
Race, ethnicity, and origin ACS 2023
- Neighborhood character
- Diverse neighborhood (Simpson 0.58)
- Race & ethnicity
- White 57% Hispanic / Latino 30% Two or more races 21% Black 7% Asian 2%
- Hispanic origin (detail)
- Mexican 2% Puerto Rican 6% Cuban 17% Dominican 1%
- Common ancestry
- Romanian 2% Hispanic 2% Lithuanian 2%
- Foreign-born
- 21% · Canada, Jamaica, China
- Languages at home
- 73% English-only · Spanish 24% French/Haitian/Cajun 1% Russian/Polish/Slavic 1%
Political lean MEDSL · Lee
- 2024 margin
- Strong R (+28.4) · D 35.5% · R 63.9%
- 2008→2024 swing
- -18.0pp toward R · 2008: -10.4pp · 2024: -28.4pp
- All cycles
- 2024: R+28.4 2020: R+19.2 2016: R+20.4 2012: R+16.6 2008: R+10.4
Not yet ingested
- Civics
- —
Market trends
- HPI YoY
- ▼ -55.34%
- Current HPI
- 337.0575
- Rent YoY
- ▼ -5.51%
- Metro
- Cape Coral-Fort Myers, FL
- State GDP YoY
- ▲ 3.28%
- F500 in state
- 36
Industry mix (Fortune 500 HQ in FL)
| Industry | F500 HQs | Revenue |
|---|---|---|
| Industrial Technology | 2 | $29B |
|
||
| Insurance | 2 | $17B |
|
||
| Retail | 1 | $60B |
|
||
| Technology Distribution | 1 | $58B |
|
||
| Homebuilding | 1 | $35B |
|
||
| Technology Manufacturing | 1 | $35B |
|
||
Price history
1 event — show timeline
- 2026-06-14 Listed $449,500 FSBO.com
Cash-flow waterfall
monthlySold comps — $/sqft
last 12 mo · ≤1 miLoading sold comps…