268 Cascade Falls Ln
Marble Falls, TX 78654
$286,499D-
4 bd · 2.0 ba ·
1,900 sqft ·
Built 2026
· SingleFamily
· Active
· 45 DOM
Cashflow @ list (25.0% down · 7.5%)
Estimated rent
$2,351/mo
Mortgage (P&I)
−$1,502
Tax + insurance
−$477
HOA
−$25
Vac / Maint / Mgmt
−$494
Net cashflow
$-148/mo
Annual
$-1,772/yr
Cap rate
5.67%
Cash-on-cash
-2.21%
DSCR
0.90
1% rule
0.82%
Cash to close
$80,220
Investor read
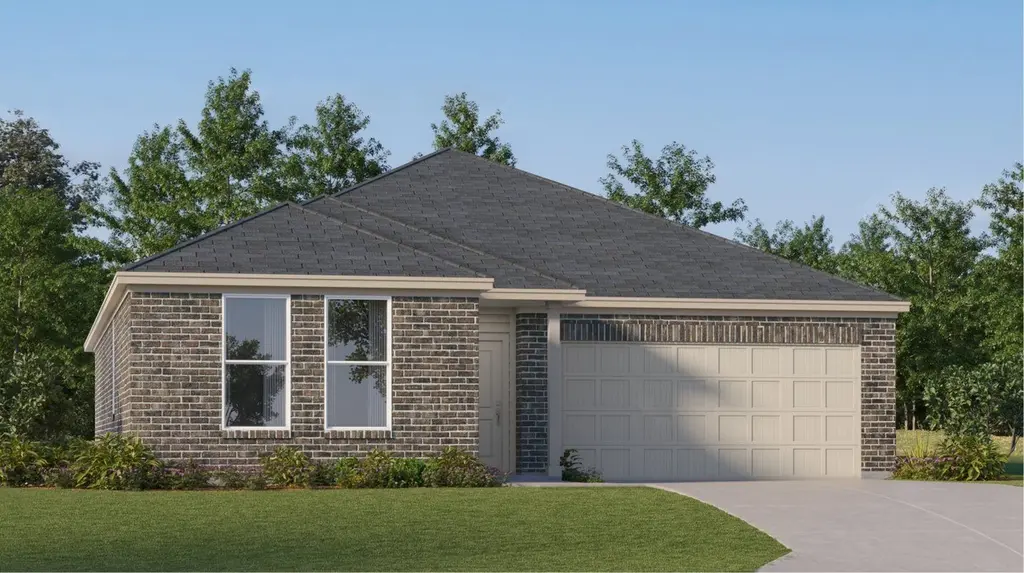
- This is a 4-bed/2.0-bath single-family listed at $286k. Condition is rated poor.
- At list price, monthly cash flow is $-148 ($-2k/yr) — negative.
- To cash-flow at today's rent, offer at most $265k (7.5% below list).
- To meet the 1% rule (rent ≥ 1% of price), the offer needs to be $235k (17.9% below list).
- It's been on market 45 days — a 3% lower offer ($278k) is reasonable based on typical stale-listing flexibility.
- Recommended offer: $235k (17.9% below list) — sets the bar for 1% rule.
- Local home prices are declining (-3.0%/yr); year-one equity from $2k of loan paydown is wiped out by about $9k of value loss. Plan a longer hold.
- Location reads 70/100 on livability (#367 in TX) — a middle-class / working-renter tenant base. Strengths: cost of living A+, health & safety A+, housing A; Watch: crime C-, employment D, amenities F.
- Marble Falls ISD (town): math 32% / reading 38% proficiency, ranked #511 of 826 in TX (top 62%) — families likely to look elsewhere, expect single-tenant / working-renter base with shorter leases.
- Zoned schools: Colt El (math 35% / reading 38%, grade F, #1,883 of 4,322 statewide, top 44%, 644 students, 62% FRL); Marble Falls Middle (math 32% / reading 37%, grade F, #858 of 1,662 statewide, top 54%, 911 students, 67% FRL); Marble Falls H S (math 29% / reading 47%, grade F, #880 of 1,632 statewide, top 54%, 1,145 students, 61% FRL).
- Market conditions: Rents soft (-0.6%/yr); 765 active listings in the ZIP; 2 comparable units currently listed for rent nearby; 891 units permitted in Burnet County in 2024 (76 in 5+ unit buildings).
- Burnet County population projected at +22% by 2050 — long-run rental-demand tailwind backs the buy-and-hold thesis.
- 2 sale attempts; this cycle's ask has dropped $20k (7%) from the opening price — seller is motivated, your offer sets the floor, not the list.
- Cap rate 5.7% vs local median 3.8% in Marble Falls — top-decile yield for the area; either an underpriced asset or a hidden risk that comps aren't pricing in. Stress-test before assuming the spread holds.
- This rent runs 38% of the median local income ($74k/yr) — at the standard rent-burdened threshold; future hikes will face affordability resistance.
Questions for listing agent
- What do current leases actually rent for vs. the listed asking? Can we see a recent rent roll and the last 12 months of T-12 income?
- It's been on market 45 days. Have you received any prior offers? Is the seller open to a 18% concession, seller financing, or rate buy-down credit?
- Have any recent inspections been done? Can we get a copy of the seller's disclosures and any deferred-maintenance estimates?
- What does the HOA fee cover, when was the last increase, and are there any pending special assessments or reserve-fund shortfalls?
- Is there a deadline driving the sale (1031 exchange, divorce, estate, relocation)? That informs how much negotiation room exists.
- Schools are D-rated, which usually means shorter tenancies and higher turnover. Who's the typical renter profile here, and what's been the actual vacancy rate?
- The area grade is low — what's the realistic commute time and amenity access for the typical tenant pool here? Any planned neighborhood developments (good or bad) we should know about?
- What's the average days-on-market for RENTAL listings here right now (not sales)? A rising rental-DOM trend means longer vacancies and softer asking-rent achievability than the comps imply.
Repairs flagged (vision-AI assessment)
- Major: roof — Significant damage visible
- Major: exterior siding — Weathered and damaged
- Major: landscaping — Overgrown vegetation
CashFlowRE · CFR-RQRCNG4GB5K90C
· Data 2 h ago
cashflowre.app · 2026-05-29