268 Cascade Falls Ln · Marble Falls, TX
Flood risk No data
- FEMA flood zone
- —
- Chance of flooding over 30 yrs
- —
- Est. flood insurance / yr
- —
Fire risk No data
- Est. fire insurance / yr
- —
Heat risk No data
- Hot days now (above threshold)
- —
- Hot days in 30 yrs
- —
Wind risk No data
- Chance of severe wind over 30 yrs
- —
Air-quality risk No data
- Unhealthy air days now
- —
- Unhealthy air days in 30 yrs
- —
Risk factors via First Street. Map © Google.
Why this score? — see what drove the D- grade
The composite is a weighted blend of 9 inputs, each scored 0–100. Each bar is that input's sub-score; the figure is the points it added to the 100-point composite (weight × sub-score).
- ARV discount +11.8/15.0
- Cash flow +10.5/30.0
- Livability +3.5/5.0
- 1% rule +3.2/10.0
- DSCR +3.0/10.0
- Schools +3.0/10.0
- Rent growth +2.3/5.0
- Condition / age +1.0/5.0
- Appreciation +0.0/10.0
$286,499
🖨 Deal sheet (PDF) 📄 Offer letter ✓ Due diligence
Listing remarks MLS
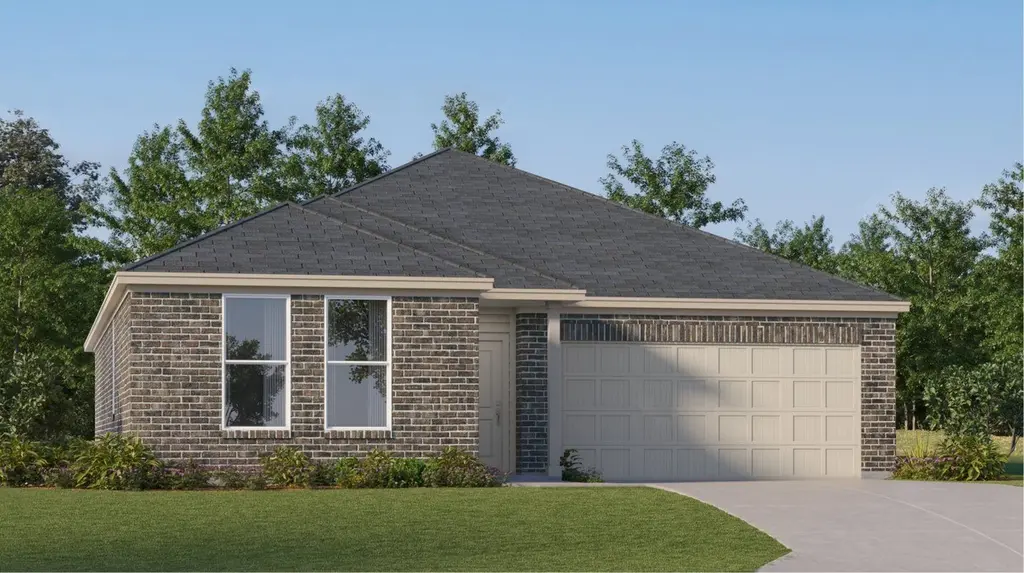
This single-story home shares an open layout between the kitchen, nook and family room for easy entertaining, along with access to the covered patio for year-round outdoor lounging. A luxe owner's suite is at the back of the home and comes complete with an en-suite bathroom and walk-in closet, while three secondary bedrooms are near the front of the home, ideal for household members and overnight guests.
Key facts
- Walk-in closet
- Open layout
- Covered patio
Tags
Property features AI
Finance
- HOA & community: Part of Thunder Rock HOA with a $25 monthly fee covering common area and grounds maintenance; Community amenities include clubhouse, community mailbox, fitness center, lake, playground, park, pool, and trails/paths
Exterior
- Parking: Attached garage with 2 covered parking spaces (2 total)
- Utilities: Electricity available; Public water; Public sewer (connected)
- Home design: Single-story home; New construction by Lennar; Southeast-facing; Has a view
- Construction: Built with brick, HardiPlank, masonry and stone; Composition roof; Slab foundation; New construction
- Exterior features: Private yard; Front yard; Back yard; Covered patio; Front porch; Patio; Community pool
Interior
- Kitchen: Dishwasher; Range
- Bedrooms: 4 main-level bedrooms
- Flooring: Carpet; Tile; Vinyl
- Bathrooms: 2 full bathrooms
- Heating & cooling: Central heating; Central air conditioning
- Interior features: Open floor plan; Kitchen island; Walk-in closets; Blinds on windows
- Laundry & utility: Dedicated laundry room
Neighborhood map
What this means for you Summary
Snapshot
- This is a 4-bed/2.0-bath single-family listed at $286k. Condition is rated poor.
Deal economics
- At list price, monthly cash flow is $-148 ($-2k/yr) — negative.
- To cash-flow at today's rent, offer at most $265k (7.5% below list).
- To meet the 1% rule (rent ≥ 1% of price), the offer needs to be $235k (17.9% below list).
- Recommended offer: $235k (17.9% below list) — sets the bar for 1% rule.
- Cap rate 5.7% vs local median 3.8% in Marble Falls — top-decile yield for the area; either an underpriced asset or a hidden risk that comps aren't pricing in. Stress-test before assuming the spread holds.
Location & tenants
- Location reads 70/100 on livability (#367 in TX) — a middle-class / working-renter tenant base. Strengths: cost of living A+, health & safety A+, housing A; Watch: crime C-, employment D, amenities F.
- Marble Falls ISD (town): math 32% / reading 38% proficiency, ranked #511 of 826 in TX (top 62%) — families likely to look elsewhere, expect single-tenant / working-renter base with shorter leases.
- Zoned schools: Colt El (math 35% / reading 38%, grade F, #1,883 of 4,322 statewide, top 44%, 644 students, 62% FRL); Marble Falls Middle (math 32% / reading 37%, grade F, #858 of 1,662 statewide, top 54%, 911 students, 67% FRL); Marble Falls H S (math 29% / reading 47%, grade F, #880 of 1,632 statewide, top 54%, 1,145 students, 61% FRL).
- Market conditions: Rents soft (-0.6%/yr); 764 active listings in the ZIP; 2 comparable units currently listed for rent nearby; 891 units permitted in Burnet County in 2024 (76 in 5+ unit buildings).
- This rent runs 38% of the median local income ($74k/yr) — at the standard rent-burdened threshold; future hikes will face affordability resistance.
Forward outlook
- Local home prices are declining (-3.0%/yr); year-one equity from $2k of loan paydown is wiped out by about $9k of value loss. Plan a longer hold.
- Burnet County population projected at +22% by 2050 — long-run rental-demand tailwind backs the buy-and-hold thesis.
Negotiation context
- It's been on market 44 days — a 3% lower offer ($278k) is reasonable based on typical stale-listing flexibility.
- 2 sale attempts; this cycle's ask has dropped $20k (7%) from the opening price — seller is motivated, your offer sets the floor, not the list.
Questions for the listing agent
- What do current leases actually rent for vs. the listed asking? Can we see a recent rent roll and the last 12 months of T-12 income?
- It's been on market 44 days. Have you received any prior offers? Is the seller open to a 18% concession, seller financing, or rate buy-down credit?
- Have any recent inspections been done? Can we get a copy of the seller's disclosures and any deferred-maintenance estimates?
- What does the HOA fee cover, when was the last increase, and are there any pending special assessments or reserve-fund shortfalls?
- Is there a deadline driving the sale (1031 exchange, divorce, estate, relocation)? That informs how much negotiation room exists.
- Schools are D-rated, which usually means shorter tenancies and higher turnover. Who's the typical renter profile here, and what's been the actual vacancy rate?
- The area grade is low — what's the realistic commute time and amenity access for the typical tenant pool here? Any planned neighborhood developments (good or bad) we should know about?
- What's the average days-on-market for RENTAL listings here right now (not sales)? A rising rental-DOM trend means longer vacancies and softer asking-rent achievability than the comps imply.
- What's the recent tenant-quality profile in this submarket — average credit score on applications, eviction rate, late-payment / NSF rate, and stable-employment percentage? A property-management company in the area should have these aggregated.
- How much new for-sale + rental construction is in the pipeline within 1–3 miles? Heavy new supply typically softens prices + rents 12–24 months out; constrained supply supports both.
Investment metrics
- 1% rule
- 0.82% ✗
- Cap rate
- 5.67%
- Cash-on-cash
- -2.21%
- DSCR
- 0.90
- GRM
- 10.2
CMA / ARV
- ARV (median comp)
- $316,990
- List price
- $286,499
- Delta
- -9.62%
- Verdict
- FAIR
- Comps
- 20 within 1.0 mi
Show comp detail 12 sales within ~0.75 mi
| Address | Dist | Beds/Ba | Sqft | Sold | Price | $/sf | Match |
|---|---|---|---|---|---|---|---|
| 104 Southridge Trl | 0.23mi | 3/2.0 (-1) | 1,949 (+3%) | 2mo | $311,999 | $160 | 79 |
| 105 Southridge Trl | 0.23mi | 3/2.0 (-1) | 1,949 (+3%) | 2mo | $292,999 | $150 | 78 |
| 109 Cascade Falls Ln | 0.25mi | 3/2.0 (-1) | 1,949 (+3%) | 1mo | $281,999 | $145 | 78 |
| 248 Rock Springs Dr | 0.24mi | 3/2.0 (-1) | 1,949 (+3%) | 2mo | $284,999 | $146 | 78 |
| 109 Southridge Trl | 0.22mi | 4/2.0 | 2,060 (+8%) | 1mo | $295,990 | $144 | 75 |
| 117 Cascade Falls Ln | 0.23mi | 4/2.0 | 1,760 (-7%) | 2mo | $250,990 | $143 | 75 |
| 240 Rock Springs Dr | 0.22mi | 4/2.0 | 2,060 (+8%) | 1mo | $304,990 | $148 | 74 |
| 124 Southridge Trl | 0.16mi | 4/2.0 | 2,097 (+10%) | 1mo | $321,740 | $153 | 74 |
| 100 Southridge Trl | 0.25mi | 4/2.0 | 2,060 (+8%) | 2mo | $320,990 | $156 | 73 |
| 264 Rock Springs Dr | 0.27mi | 4/2.0 | 2,060 (+8%) | 2mo | $297,990 | $145 | 72 |
| 100 Cascade Falls Ln | 0.28mi | 4/2.0 | 2,060 (+8%) | 1mo | $332,990 | $162 | 72 |
| 128 Southridge Trl | 0.15mi | 4/3.0 | 2,109 (+11%) | 1mo | $329,990 | $156 | 70 |
Match score weights: distance 35% · size 25% · config 20% · recency 20%. Top-matched comps best support the ARV.
Projected returns pro-forma
-3.0% appreciation · 0.0% rent growth · sell at horizon
- IRR
- -23.4%
- Equity multiple
- 0.22×
- Total profit
- $-62,670
- Equity at exit
- $42,718
- IRR
- -29.3%
- Equity multiple
- -0.16×
- Total profit
- $-93,103
- Equity at exit
- $24,771
Cash invested: $80,220 (down + closing). Projections, not guarantees.
Landlord ↔ Tenant lean methodology
- Overall (STATE)
- 87 Strongly Landlord-Friendly
- State Texas
- 87 Strongly Landlord-Friendly · R+5
- County
- — inherits STATE
- City
- — inherits STATE
ZIP-level market 78654
- Home prices YoY
- -31.8%
- Rents YoY
- -0.6%
- Active inventory
- 764
- Price-to-rent
- 10.2×
Monthly cashflow live
- Estimated rent
- $2,351 medium interval (Pro) →
- Mortgage (P&I)
- −$1,502
- Tax est. 1.5%
- −$358 /mo · $4,297/yr
- Insurance
- −$119
- HOA
- −$25
- Vacancy / Maint / Mgmt
- −$494
- Net cashflow
- $-148
Break-even live
Sensitivity live
| Price | -10% $50 | -5% $-49 | +0% $-148 | +5% $-247 | +10% $-346 |
|---|---|---|---|---|---|
| Rent | -10% $-333 | -5% $-241 | +0% $-148 | +5% $-55 | +10% $38 |
| Rate | -1.0pp $-3 | -0.5pp $-75 | base $-148 | +0.5pp $-222 | +1.0pp $-297 |
UW: 25.0% down · 7.5% · 30yr · 1.5% tax · 5.0% vac · 8.0% maint · 8.0% mgmt
Financing live
Cash to close
- Down payment
- $71,625
- Closing costs
- $8,595
- Reserves months
- —
- Total cash needed
- —
Loan-product check · same deal, 3 products live
Conventional
25% down · 7.5% · 30yr
- Down + closing
- —
- Monthly P&I
- —
- Monthly cashflow
- —
- DSCR
- —
- Eligible?
- —
Personal DTI + credit; lowest rate.
DSCR
20% down · 8.5% · 30yr
- Down + closing
- —
- Monthly P&I
- —
- Monthly cashflow
- —
- DSCR
- —
- Eligible?
- —
No personal income docs; deal must DSCR.
Hard money
10% down · 12.0% · 12mo
- Down + closing
- —
- Monthly P&I
- —
- Monthly cashflow
- —
- DSCR
- —
- Eligible?
- —
Short-term bridge; refi at stabilization.
Rent comps 2 comps
| Address | Beds | Baths | Sqft | Rent | $/sqft | DOM | Units | Dist |
|---|---|---|---|---|---|---|---|---|
| 252 Rock Springs Dr Marble Falls, TX | 4.0 | 2.0 | 1666 | $2,300 | $1.38 | 45d | 1 | 0.25mi |
| 169 Standing Rock Ln Marble Falls, TX | 4.0 | 3.0 | 2525 | $2,750 | $1.09 | 6d | 1 | 0.48mi |
HOA detail
- Monthly dues
- $25 · $300/yr
Listing history 21 events
-
2026-06-21days on market $286,499 Active 44 DOM
-
2026-06-18days on market $286,499 Active 41 DOM
-
2026-06-17days on market $286,499 Active 40 DOM
-
2026-06-16days on market $286,499 Active 39 DOM
-
2026-06-15days on market $286,499 Active 38 DOM
-
2026-06-13days on market $286,499 Active 36 DOM
-
2026-06-13days on market $286,499 Active 35 DOM
-
2026-06-09pricedays on market $286,499 Active 32 DOM
-
2026-06-08days on market $285,999 Active 31 DOM
-
2026-06-07days on market $285,999 Active 30 DOM
-
2026-06-05pricedays on market $285,999 Active 27 DOM
-
2026-06-03days on market $286,999 Active 26 DOM
Show marketing remark (407 chars)
This single-story home shares an open layout between the kitchen, nook and family room for easy entertaining, along with access to the covered patio for year-round outdoor lounging. A luxe owner's suite is at the back of the home and comes complete with an en-suite bathroom and walk-in closet, while three secondary bedrooms are near the front of the home, ideal for household members and overnight guests.
-
2026-06-02days on market $286,999 Active 25 DOM
-
2026-06-01days on market $286,999 Active 24 DOM
-
2026-05-31days on market $286,999 Active 23 DOM
-
2026-05-15price $286,999 407-char remark
Show marketing remark (407 chars)
This single-story home shares an open layout between the kitchen, nook and family room for easy entertaining, along with access to the covered patio for year-round outdoor lounging. A luxe owner's suite is at the back of the home and comes complete with an en-suite bathroom and walk-in closet, while three secondary bedrooms are near the front of the home, ideal for household members and overnight guests.
-
2026-05-14price $286,999 677-char remark
Show marketing remark (407 chars)
This single-story home shares an open layout between the kitchen, nook and family room for easy entertaining, along with access to the covered patio for year-round outdoor lounging. A luxe owner's suite is at the back of the home and comes complete with an en-suite bathroom and walk-in closet, while three secondary bedrooms are near the front of the home, ideal for household members and overnight guests.
-
2026-05-14$306,999 Active 407-char remark
Show marketing remark (407 chars)
This single-story home shares an open layout between the kitchen, nook and family room for easy entertaining, along with access to the covered patio for year-round outdoor lounging. A luxe owner's suite is at the back of the home and comes complete with an en-suite bathroom and walk-in closet, while three secondary bedrooms are near the front of the home, ideal for household members and overnight guests.
-
2026-05-12price $306,499 677-char remark
-
2026-05-11price $305,999 677-char remark
-
2026-05-08$303,999 Active 677-char remark
ⓘ Source: listings_history table (triggers on properties + properties_extension) + one-shot
backfill from property_details.listing_events for pre-trigger history.
Nearby sold comps map
Loading sold comps map…
Walkable amenities ~0.75 mi
Loading nearby amenities…
Taxation est. · year 1
- Rental income
- $28,211
- − Mortgage interest
- −$16,048
- − Property taxes
- −$4,297
- − Insurance
- −$1,432
- − Repairs & maintenance
- −$2,257
- − Management
- −$2,257
- − HOA
- −$300
- − Depreciation
- −$8,335
- Taxable loss
- −$6,715
- Est. tax savings @ 24.0%
- +$1,612
- After-tax cash flow
- $-160/yr
For passive investors: Depreciation is non-cash, so a rental often shows a tax loss while cash-flowing — sheltering income. Rental losses are passive: they offset passive income freely, and up to $25,000/yr can offset ordinary (W-2) income if you actively participate and your MAGI is under $100k (phasing out to $0 by $150k); unused losses carry forward. On sale, claimed depreciation is recaptured at up to 25%, and gains may owe capital-gains tax (a 1031 exchange can defer both). Figures are a year-1 estimate at your 24.0% rate — not tax advice; consult a CPA.
Condition & rehab AI · 2 photos
This single-story home requires extensive repairs, including a major roof replacement and exterior siding repair, to become move-in ready. Landscaping improvements are also needed to enhance curb appeal.
Repairs flagged
- Major roof — Significant damage visible
- Major exterior siding — Weathered and damaged
- Major landscaping — Overgrown vegetation
Value-add opportunities
- Resale roof repair — Fixing the roof is a critical safety and value improvement
- Resale exterior siding repair — Repairing the siding will improve the home's curb appeal
- Both landscaping — A well-maintained yard enhances both resale and rental value
Renovation cost estimate screening
| Repair item | Severity | Est. cost |
|---|---|---|
| roof · Significant damage visible | Major | $15,000–50,000 |
| exterior siding · Weathered and damaged | Major | $15,000–50,000 |
| landscaping · Overgrown vegetation | Major | $15,000–50,000 |
| Total estimated repair cost · 3 items | $45,000–150,000 |
Value-add ROI direction
- Resale roof repair — Fixing the roof is a critical safety and value improvement ↑
- Resale exterior siding repair — Repairing the siding will improve the home's curb appeal ↑
- Both landscaping — A well-maintained yard enhances both resale and rental value ↑
ⓘ Cost ranges are severity-bucket heuristics (US national rule-of-thumb). Get contractor quotes + a written scope before underwriting a rehab budget.
Schools (NCES district)
- District
- Marble Falls ISD
- NCES district ID
- 4829010
- Math proficiency
- 32% ▼ -8.00%
- Reading proficiency
- 38% ▼ -4.00%
- Median HH income
- $49,663
- Composite
- 30.3/100
- National rank
- #6278
- State rank
- #511 of 826 in TX
Livability — Marble Falls
- Score
- 70/100
- State rank
- #367
- US rank
- #7802
Category grades
Schools grade is shown separately in the Schools card above.
Census & demographics
- Census place
- Marble Falls, TX
- County
- Burnet County · 35,210 people
- City population
- 20,650
- Metro
- Austin-Round Rock-Georgetown, TX
- Population (ZIP)
- 20,650
- Household income
- $74,130
- Rent vs Own
- Severe rent burden
- 354.0
Population outlook (Burnet County) Hauer SSP2
- Today (2025)
- 50,492 people
- By 2030
- 52,995 · +5.0%
- By 2040
- 57,528 · +13.9%
- By 2050
- 61,444 · +21.7%
- By 2075
- 71,098 · +40.8%
- By 2100
- 74,634 · +47.8%
Race, ethnicity, and origin ACS 2023
- Neighborhood character
- Predominantly White (68%)
- Race & ethnicity
- White 68% Hispanic / Latino 28% Two or more races 8%
- Hispanic origin (detail)
- Mexican 24%
- Common ancestry
- Serbian 2% Italian 2% Slovak 2%
- Foreign-born
- 8% · Canada
- Languages at home
- 81% English-only · Spanish 18% Other Indo-European 1%
Political lean MEDSL · Burnet
- 2024 margin
- Solid R (+55.7) · D 21.7% · R 77.4%
- 2008→2024 swing
- -11.6pp toward R · 2008: -44.1pp · 2024: -55.7pp
- All cycles
- 2024: R+55.7 2020: R+53.1 2016: R+56.8 2012: R+54.6 2008: R+44.1
Not yet ingested
- Civics
- —
Market trends
- HPI YoY
- ▼ -118.02%
- Current HPI
- 252.9861
- Rent YoY
- ▼ -0.62%
- Metro
- Austin-Round Rock-Georgetown, TX
- State GDP YoY
- ▲ 3.95%
- F500 in state
- 110
Industry mix (Fortune 500 HQ in TX)
| Industry | F500 HQs | Revenue |
|---|---|---|
| Energy | 16 | $1,198B |
|
||
| Technology | 5 | $198B |
|
||
| Engineering / Construction | 4 | $72B |
|
||
| Energy Services | 3 | $60B |
|
||
| Utilities | 3 | $41B |
|
||
| Healthcare | 2 | $330B |
|
||
Price history
-5.8% since first listed10 events — show timeline
- 2026-06-08 Price Changed $286,499 Unlock MLS
- 2026-06-06 Price Changed $286,499 Zillow
- 2026-06-03 Price Changed $285,999 Unlock MLS
- 2026-06-03 Price Changed $285,999 Zillow
- 2026-05-15 Price Changed $286,999 Zillow
- 2026-05-14 Price Changed $286,999 Unlock MLS
- 2026-05-14 Listed $306,999 Zillow
- 2026-05-12 Price Changed $306,499 Unlock MLS
- 2026-05-11 Price Changed $305,999 Unlock MLS
- 2026-05-08 Listed $303,999 Unlock MLS
Cash-flow waterfall
monthlySold comps — $/sqft
last 12 mo · ≤1 miLoading sold comps…