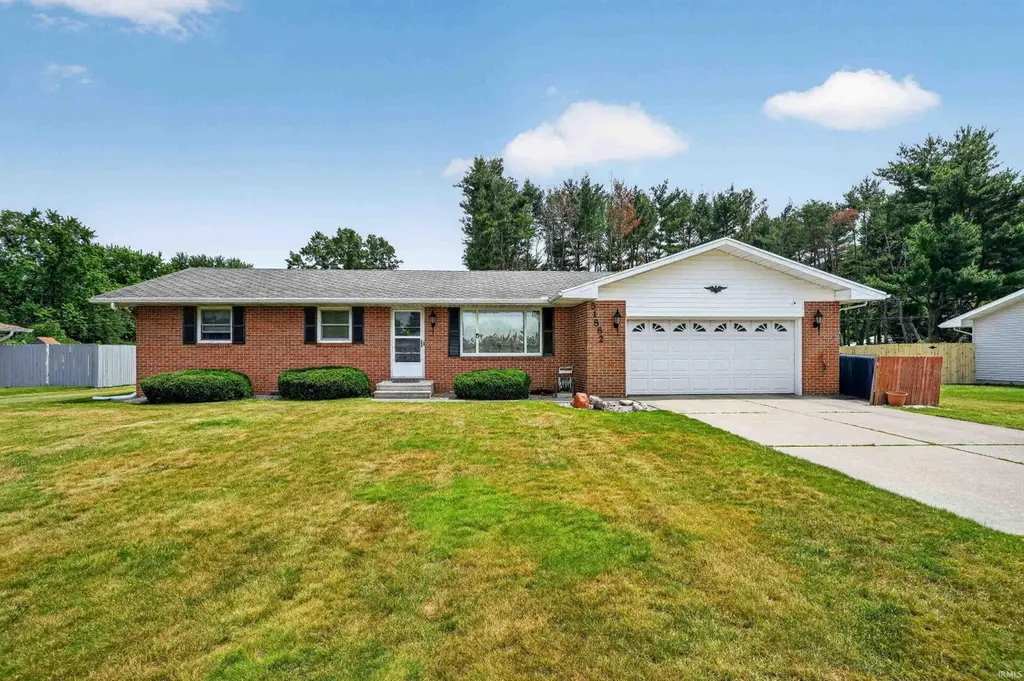
51882 Cheryl Dr
Granger, IN 46530
$280,000D-
3 bd · 1.5 ba ·
1,360 sqft ·
Built 1974
· SingleFamily
· Pending
· 2 DOM
Cashflow @ list (25.0% down · 7.5%)
Estimated rent
$2,147/mo
Mortgage (P&I)
−$1,468
Tax + insurance
−$279
HOA
−$0
Vac / Maint / Mgmt
−$451
Net cashflow
$-51/mo
Annual
$-616/yr
Cap rate
6.07%
Cash-on-cash
-0.79%
DSCR
0.97
1% rule
0.77%
Cash to close
$78,400
Investor read
- This is a 3-bed/1.5-bath single-family listed at $280k.
- At list price, monthly cash flow is $-51 ($-616/yr) — negative.
- To cash-flow at today's rent, offer at most $271k (3.2% below list).
- To meet the 1% rule (rent ≥ 1% of price), the offer needs to be $215k (23.3% below list).
- Only 2 days on market — expect competitive offers; lowballing is unlikely to land.
- Recommended offer: $215k (23.3% below list) — sets the bar for 1% rule.
- Local home prices are declining (-3.0%/yr); year-one equity from $2k of loan paydown is wiped out by about $8k of value loss. Plan a longer hold.
- Location reads 78/100 on livability (#33 in IN, #2,584 nationally) — a middle-class / working-renter tenant base. Strengths: crime A+, employment A+, cost of living A+; Watch: amenities F, commute F.
- Penn-Harris-Madison School Corporation (suburban): math 54% / reading 64% proficiency, ranked #19 of 301 in IN (top 6%) — acceptable for families but not a draw, mixed tenant base, ~2y average lease.
- Zoned schools: Mary Frank Harris Elementary Sch (math 82% / reading 72%, grade A, #13 of 994 statewide, top 1%, 475 students, 22% FRL); Discovery Middle School (math 57% / reading 75%, grade A-, #6 of 330 statewide, top 2%, 848 students, 17% FRL); Penn High School (math 53% / reading 83%, grade B, #22 of 369 statewide, top 6%, 3,624 students, 27% FRL) — zoned schools at 22% FRL track the district average.
- Market conditions: 204 active listings in the ZIP; 1 comparable units currently listed for rent nearby; high-income renter base; 754 units permitted in St. Joseph County in 2024 (460 in 5+ unit buildings).
- Cap rate 6.1% vs local median 3.3% in Granger — top-decile yield for the area; either an underpriced asset or a hidden risk that comps aren't pricing in. Stress-test before assuming the spread holds.
Questions for listing agent
- What do current leases actually rent for vs. the listed asking? Can we see a recent rent roll and the last 12 months of T-12 income?
- Built in 1974 — when were the roof, HVAC, electrical panel, plumbing, and water heater last replaced?
- Is there a deadline driving the sale (1031 exchange, divorce, estate, relocation)? That informs how much negotiation room exists.
- Schools are A-rated — typically a magnet for longer-tenancy family renters. What's the average tenant stay here, and is there a school-zone premium baked into asking?
- The area grade is low — what's the realistic commute time and amenity access for the typical tenant pool here? Any planned neighborhood developments (good or bad) we should know about?
- What's the average days-on-market for RENTAL listings here right now (not sales)? A rising rental-DOM trend means longer vacancies and softer asking-rent achievability than the comps imply.
- What's the recent tenant-quality profile in this submarket — average credit score on applications, eviction rate, late-payment / NSF rate, and stable-employment percentage? A property-management company in the area should have these aggregated.
- How much new for-sale + rental construction is in the pipeline within 1–3 miles? Heavy new supply typically softens prices + rents 12–24 months out; constrained supply supports both.
CashFlowRE · CFR-RTKP8C4AEKF65R
· Data 1 week ago
cashflowre.app · 2026-05-29