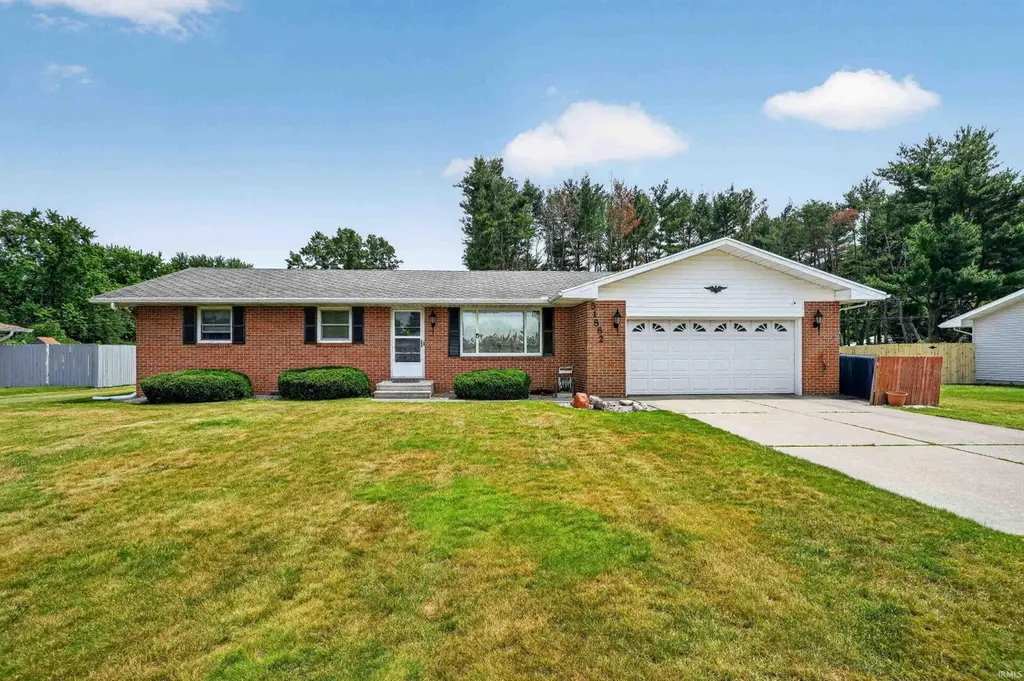
51882 Cheryl Dr · Granger, IN
Flood risk 1/10 · Minimal
- FEMA flood zone
- X (unshaded)
- Chance of flooding over 30 yrs
- 0.0%
- Est. flood insurance / yr
- $473 – $860
Fire risk 1/10 · Minimal
- Est. fire insurance / yr
- $717 – $1,331
Heat risk 2/10 · Minimal
- Hot days now (above 99°F)
- 7 days/yr
- Hot days in 30 yrs
- 16 days/yr
Wind risk 2/10 · Minimal
- Chance of severe wind over 30 yrs
- —
Air-quality risk 3/10 · Minor
- Unhealthy air days now
- 2 days/yr
- Unhealthy air days in 30 yrs
- 3 days/yr
Risk factors via First Street. Map © Google.
Why this score? — see what drove the D- grade
The composite is a weighted blend of 9 inputs, each scored 0–100. Each bar is that input's sub-score; the figure is the points it added to the 100-point composite (weight × sub-score).
- Cash flow +12.3/30.0
- ARV discount +6.6/15.0
- Schools +5.1/10.0
- Livability +3.9/5.0
- DSCR +3.7/10.0
- 1% rule +2.7/10.0
- Rent growth +2.5/5.0
- Condition / age +2.5/5.0
- Appreciation +0.0/10.0
$280,000
🖨 Deal sheet 📄 Offer letter ✓ Due diligence
Listing remarks
Imagine yourself pulling into the driveway after a long day, leaving the noise of the world behind. Nestled away from the hustle and bustle, yet conveniently close to shopping, dining, and everyday amenities, this charming brick ranch offers the perfect balance of peace and convenience. Step inside and you'll immediately feel the warmth of a home that is ready for new memories. The spacious main level features three bedrooms, one and a half bathrooms, along with plenty of room for family, guests, and that home office you've been dreaming about. Morning coffee just hits differently in the screened-in porch, where you can enjoy the fresh air without battling our swirling winged friends on the
Key facts
- Screened in porch
- Finished basement
- 0.37 acre lot
Tags
Property features AI
Exterior
- Parking: Attached garage with garage door opener; Two garage spaces; Second detached garage (other structure)
- Utilities: Well water; Septic tank
- Home design: Single-family residence (site-built); One story
- Construction: Brick and vinyl siding exterior
- Exterior features: Screened porch; Porch; Landscaped lot
Interior
- Kitchen: Dishwasher; Refrigerator; Electric range
- Flooring: Carpet; Vinyl
- Bathrooms: One full bathroom; One half bathroom
- Heating & cooling: Natural gas forced air heating; Central air conditioning; Ceiling fan(s) for cooling
- Interior features: Ceiling fans; Eat-in kitchen; Finished full basement
- Laundry & utility: Laundry located on lower level
Neighborhood map
What this means for you Summary
Snapshot
- This is a 3-bed/1.5-bath single-family listed at $280k.
Deal economics
- At list price, monthly cash flow is $-51 ($-616/yr) — negative.
- To cash-flow at today's rent, offer at most $271k (3.2% below list).
- To meet the 1% rule (rent ≥ 1% of price), the offer needs to be $215k (23.3% below list).
- Recommended offer: $215k (23.3% below list) — sets the bar for 1% rule.
- Cap rate 6.1% vs local median 3.3% in Granger — top-decile yield for the area; either an underpriced asset or a hidden risk that comps aren't pricing in. Stress-test before assuming the spread holds.
Location & tenants
- Location reads 78/100 on livability (#33 in IN, #2,584 nationally) — a middle-class / working-renter tenant base. Strengths: crime A+, employment A+, cost of living A+; Watch: amenities F, commute F.
- Penn-Harris-Madison School Corporation (suburban): math 54% / reading 64% proficiency, ranked #19 of 301 in IN (top 6%) — acceptable for families but not a draw, mixed tenant base, ~2y average lease.
- Zoned schools: Mary Frank Harris Elementary Sch (math 82% / reading 72%, grade A, #13 of 994 statewide, top 1%, 475 students, 22% FRL); Discovery Middle School (math 57% / reading 75%, grade A-, #6 of 330 statewide, top 2%, 848 students, 17% FRL); Penn High School (math 53% / reading 83%, grade B, #22 of 369 statewide, top 6%, 3,624 students, 27% FRL) — zoned schools at 22% FRL track the district average.
- Market conditions: 204 active listings in the ZIP; 1 comparable units currently listed for rent nearby; high-income renter base; 754 units permitted in St. Joseph County in 2024 (460 in 5+ unit buildings).
Forward outlook
- Local home prices are declining (-3.0%/yr); year-one equity from $2k of loan paydown is wiped out by about $8k of value loss. Plan a longer hold.
Negotiation context
- Only 2 days on market — expect competitive offers; lowballing is unlikely to land.
Questions for the listing agent
- What do current leases actually rent for vs. the listed asking? Can we see a recent rent roll and the last 12 months of T-12 income?
- Built in 1974 — when were the roof, HVAC, electrical panel, plumbing, and water heater last replaced?
- Is there a deadline driving the sale (1031 exchange, divorce, estate, relocation)? That informs how much negotiation room exists.
- Schools are A-rated — typically a magnet for longer-tenancy family renters. What's the average tenant stay here, and is there a school-zone premium baked into asking?
- The area grade is low — what's the realistic commute time and amenity access for the typical tenant pool here? Any planned neighborhood developments (good or bad) we should know about?
- What's the average days-on-market for RENTAL listings here right now (not sales)? A rising rental-DOM trend means longer vacancies and softer asking-rent achievability than the comps imply.
- What's the recent tenant-quality profile in this submarket — average credit score on applications, eviction rate, late-payment / NSF rate, and stable-employment percentage? A property-management company in the area should have these aggregated.
- How much new for-sale + rental construction is in the pipeline within 1–3 miles? Heavy new supply typically softens prices + rents 12–24 months out; constrained supply supports both.
Investment metrics
- 1% rule
- 0.77% ✗
- Cap rate
- 6.07%
- Cash-on-cash
- -0.79%
- DSCR
- 0.97
- GRM
- 10.9
CMA / ARV
- ARV (on-the-fly)
- $274,720
- Comps found
- 8
Show comp detail 8 sales within ~0.75 mi
| Address | Dist | Beds/Ba | Sqft | Sold | Price | $/sf | Match |
|---|---|---|---|---|---|---|---|
| 51900 Cheryl Dr | 0.02mi | 4/2.0 (+1) | 1,496 (+10%) | 3mo | $305,000 | $204 | 73 |
| 51851 Hinton Ln | 0.27mi | 3/2.0 | 1,300 (-4%) | 12mo | $265,000 | $204 | 68 |
| 51891 Covered Wagon Trl | 0.18mi | 3/2.0 | 1,490 (+10%) | 8mo | $301,500 | $202 | 67 |
| 51485 W Timberline Trace Dr | 0.40mi | 3/2.0 | 1,480 (+9%) | 4mo | $325,000 | $220 | 61 |
| 51278 Arch St | 0.62mi | 3/1.5 | 1,290 (-5%) | 10mo | $225,000 | $174 | 55 |
| 12311 Covered Wagon Trl | 0.50mi | 3/2.0 | 1,440 (+6%) | 14mo | $280,000 | $194 | 53 |
| 13229 Anderson Rd | 0.62mi | 2/1.0 (-1) | 1,300 (-4%) | 10mo | $215,000 | $165 | 48 |
| 51883 Sharon Ct | 0.20mi | 4/1.5 (+1) | 1,520 (+12%) | 22mo | $300,000 | $197 | 48 |
Match score weights: distance 35% · size 25% · config 20% · recency 20%. Top-matched comps best support the ARV.
Projected returns pro-forma
-3.0% appreciation · 3.0% rent growth · sell at horizon
- IRR
- -17.6%
- Equity multiple
- 0.38×
- Total profit
- $-48,724
- Equity at exit
- $41,749
- IRR
- -9.8%
- Equity multiple
- 0.40×
- Total profit
- $-46,975
- Equity at exit
- $24,209
Cash invested: $78,400 (down + closing). Projections, not guarantees.
Landlord ↔ Tenant lean methodology
- Overall (STATE)
- 90 Strongly Landlord-Friendly
- State Indiana
- 90 Strongly Landlord-Friendly · R+11
- County
- — inherits STATE
- City
- — inherits STATE
ZIP-level market 46530
- Home prices YoY
- -32.8%
- Active inventory
- 204
- Price-to-rent
- 10.9×
Monthly cashflow live
- Estimated rent
- $2,147 medium interval (Pro) →
- Mortgage (P&I)
- −$1,468
- Tax from tax record
- −$162 /mo · $1,949/yr
- Insurance
- −$117
- HOA
- −$0
- Vacancy / Maint / Mgmt
- −$451
- Net cashflow
- $-51
Break-even live
UW: 25.0% down · 7.5% · 30yr · 1.5% tax · 5.0% vac · 8.0% maint · 8.0% mgmt
Financing live
Cash to close
- Down payment
- $70,000
- Closing costs
- $8,400
- Reserves months
- —
- Total cash needed
- —
Loan-product check · same deal, 3 products live
Conventional
25% down · 7.5% · 30yr
- Down + closing
- —
- Monthly P&I
- —
- Monthly cashflow
- —
- DSCR
- —
- Eligible?
- —
Personal DTI + credit; lowest rate.
DSCR
20% down · 8.5% · 30yr
- Down + closing
- —
- Monthly P&I
- —
- Monthly cashflow
- —
- DSCR
- —
- Eligible?
- —
No personal income docs; deal must DSCR.
Hard money
10% down · 12.0% · 12mo
- Down + closing
- —
- Monthly P&I
- —
- Monthly cashflow
- —
- DSCR
- —
- Eligible?
- —
Short-term bridge; refi at stabilization.
Rent comps 1 comps
| Address | Beds | Baths | Sqft | Rent | $/sqft | DOM | Units | Dist |
|---|---|---|---|---|---|---|---|---|
| 13964 State Road 23 Granger, IN | 3.0 | 1.0 | 1008 | $2,100 | $2.08 | 13d | 1 | 1.35mi |
Listing history 3 events
-
2026-06-13statusdays on market $280,000 Pending 2 DOM
-
2026-06-10remarks 699-char remark
-
2026-06-10$280,000 Active 1 DOM
ⓘ Source: listings_history table (triggers on properties + properties_extension) + one-shot
backfill from property_details.listing_events for pre-trigger history.
Tax reassessment forecast IN · Partial reset (capped growth)
- Current annual tax
- $1,949 · $162/mo
- Projected year-2 tax
- $2,165 · $180/mo
- Expected delta
- +$215/yr (+$18/mo · 11.0%)
ⓘ Screening estimate from a state-policy table — verify with the county assessor before closing.
Climate risk First Street
- Flood 1/10 Low FEMA zone X (unshaded) · 0% chance over 30 yrs
- Wildfire 1/10 Low
- Heat 2/10 Low 7 d/yr ≥99°F today · 16 d/yr by 30 yrs out
- Wind 2/10 Low
- Air quality 3/10 Moderate 2 unhealthy d/yr today · 3 by 30 yrs out
Nearby sold comps map
Loading sold comps map…
Walkable amenities ~0.75 mi
Loading nearby amenities…
Taxation est. · year 1
- Rental income
- $25,764
- − Mortgage interest
- −$15,684
- − Property taxes
- −$1,949
- − Insurance
- −$1,400
- − Repairs & maintenance
- −$2,061
- − Management
- −$2,061
- − Depreciation
- −$8,145
- Taxable loss
- −$5,537
- Est. tax savings @ 24.0%
- +$1,329
- After-tax cash flow
- $713/yr
For passive investors: Depreciation is non-cash, so a rental often shows a tax loss while cash-flowing — sheltering income. Rental losses are passive: they offset passive income freely, and up to $25,000/yr can offset ordinary (W-2) income if you actively participate and your MAGI is under $100k (phasing out to $0 by $150k); unused losses carry forward. On sale, claimed depreciation is recaptured at up to 25%, and gains may owe capital-gains tax (a 1031 exchange can defer both). Figures are a year-1 estimate at your 24.0% rate — not tax advice; consult a CPA.
Schools (NCES district)
- District
- Penn-Harris-Madison School Corporation
- NCES district ID
- 1808760
- Math proficiency
- 54% ▼ -11.00%
- Reading proficiency
- 64% ▼ -6.00%
- Median HH income
- $59,421
- Composite
- 51.11/100
- National rank
- #1764
- State rank
- #19 of 301 in IN
Livability — Granger
- Score
- 78/100
- State rank
- #33
- US rank
- #2584
Category grades
Schools grade is shown separately in the Schools card above.
Census & demographics
- Census place
- Granger, IN
- County
- Saint Joseph County · 189,048 people
- City population
- 31,598
- Metro
- South Bend-Mishawaka, IN-MI
- Population (ZIP)
- 31,598
- Household income
- $122,129
- Rent vs Own
- Severe rent burden
- 671.0
Population outlook (St. Joseph County) Hauer SSP2
- Today (2025)
- 273,186 people
- By 2030
- 273,594 · +0.1%
- By 2040
- 271,641 · -0.6%
- By 2050
- 269,187 · -1.5%
- By 2075
- 263,136 · -3.7%
- By 2100
- 245,659 · -10.1%
Race, ethnicity, and origin ACS 2023
- Neighborhood character
- Predominantly White (80%)
- Race & ethnicity
- White 80% Asian 7% Two or more races 7% Hispanic / Latino 6% Black 2%
- Hispanic origin (detail)
- Mexican 4%
- Common ancestry
- Romanian 8% Slovak 3% Italian 3%
- Foreign-born
- 8% · Canada, South Korea, China
- Languages at home
- 89% English-only · Other Indo-European 3% Spanish 2% German/W. Germanic 1%
Political lean MEDSL · St. Joseph
- 2024 margin
- Toss-up / Even · D 50.0% · R 48.5% · Other 1.5%
- 2008→2024 swing
- -15.6pp toward R · 2008: 17.1pp · 2024: 1.5pp
- All cycles
- 2024: D+1.5 2020: D+5.8 2016: D+0.2 2012: D+3.5 2008: D+17.1
Not yet ingested
- Civics
- —
Market trends
- HPI YoY
- ▼ -94.73%
- Current HPI
- 194.0944
- Rent YoY
- —
- Metro
- South Bend-Mishawaka, IN-MI
- State GDP YoY
- ▲ 2.90%
- F500 in state
- 18
Industry mix (Fortune 500 HQ in IN)
| Industry | F500 HQs | Revenue |
|---|---|---|
| Industrial Machinery | 2 | $37B |
|
||
| Healthcare | 1 | $177B |
|
||
| Pharmaceuticals | 1 | $45B |
|
||
| Metals / Steel | 1 | $18B |
|
||
| Agriculture | 1 | $17B |
|
||
| Packaging | 1 | $12B |
|
||
Price history
1 event — show timeline
- 2026-06-09 Listed $280,000 IRMLS
Property tax history
+3.0%/yrLatest (2025): $1,949 · +3.5% YoY. Source: county tax records.
Cash-flow waterfall
monthlySold comps — $/sqft
last 12 mo · ≤1 miLoading sold comps…