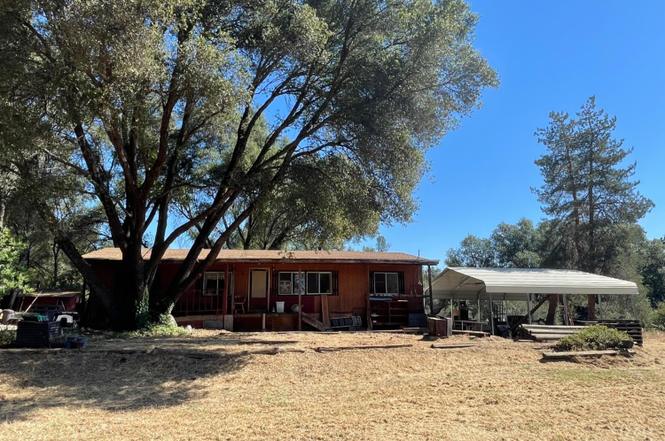
3877 Lopa Rd
Bootjack, CA 95338
$175,000D+
3 bd · 2.0 ba ·
1,152 sqft ·
Built 1983
· SingleFamily
· Active
· 2 DOM
Cashflow @ list (25.0% down · 7.5%)
Estimated rent
$1,700/mo
Mortgage (P&I)
−$918
Tax + insurance
−$201
HOA
−$0
Vac / Maint / Mgmt
−$357
Net cashflow
$225/mo
Annual
$2,695/yr
Cap rate
7.83%
Cash-on-cash
5.50%
DSCR
1.24
1% rule
0.97%
Cash to close
$49,000
Investor read
- This is a 3-bed/2.0-bath single-family listed at $175k.
- At list price, monthly cash flow is $225 ($3k/yr) — positive.
- The deal already cash-flows at list — no discount required.
- To meet the 1% rule (rent ≥ 1% of price), the offer needs to be $170k (2.9% below list).
- Only 2 days on market — expect competitive offers; lowballing is unlikely to land.
- Recommended offer: $170k (2.9% below list) — sets the bar for 1% rule.
- Local home prices are declining (-3.0%/yr); year-one equity from $1k of loan paydown is wiped out by about $5k of value loss. Plan a longer hold.
- Location reads 48/100 on livability (#1,203 in CA) — a working-class tenant base; expect higher turnover. Strengths: housing B; Watch: employment C-, crime F, amenities F.
- Mariposa County Unified (rural): math 27% / reading 42% proficiency, ranked #282 of 517 in CA (top 54%) — families likely to look elsewhere, expect single-tenant / working-renter base with shorter leases.
- Zoned schools: Mariposa County High (math 47% / reading 57%, grade D+, #296 of 1,170 statewide, top 27%, 448 students, 61% FRL).
- Zoned-school proficiency averages 52% at this address vs 34% district-wide (+18 pts) — the actual schools serving this property are materially stronger than the Mariposa County Unified average implies; a family-tenant draw the district grade alone would hide.
- Market conditions: 167 active listings in the ZIP; 1 comparable units currently listed for rent nearby; 89 units permitted in Mariposa County in 2024 (0 in 5+ unit buildings).
- Mariposa County population projected at -23% by 2050 — secular population decline; favor cash flow + early exit over multi-decade hold.
- 2 sale attempts with the ask held roughly flat each time — persistent listings suggest the price (not the market) is what's stuck; bring a comps-based counter.
- Current owner paid $120k; 46% above their basis — modest negotiation headroom, anchor on the comps not their cost.
- Climate carrying-cost: severe wildfire risk; extreme-heat days projected 9→22/yr by 2055 (HVAC capex compounding) — expect insurance premiums to compound above CPI over the hold.
- Cap rate 7.8% vs local median 3.4% in Bootjack — top-decile yield for the area; either an underpriced asset or a hidden risk that comps aren't pricing in. Stress-test before assuming the spread holds.
Questions for listing agent
- Is there a deadline driving the sale (1031 exchange, divorce, estate, relocation)? That informs how much negotiation room exists.
- Crime grade is F in this area — have there been break-ins, vandalism, or insurance claims at this property in the last 3 years? What carrier currently insures it and at what premium?
- The area grade is low — what's the realistic commute time and amenity access for the typical tenant pool here? Any planned neighborhood developments (good or bad) we should know about?
- What's the average days-on-market for RENTAL listings here right now (not sales)? A rising rental-DOM trend means longer vacancies and softer asking-rent achievability than the comps imply.
- What's the recent tenant-quality profile in this submarket — average credit score on applications, eviction rate, late-payment / NSF rate, and stable-employment percentage? A property-management company in the area should have these aggregated.
- How much new for-sale + rental construction is in the pipeline within 1–3 miles? Heavy new supply typically softens prices + rents 12–24 months out; constrained supply supports both.
CashFlowRE · CFR-RTVQ72784S3H7Y
· Data 1 day ago
cashflowre.app · 2026-05-29