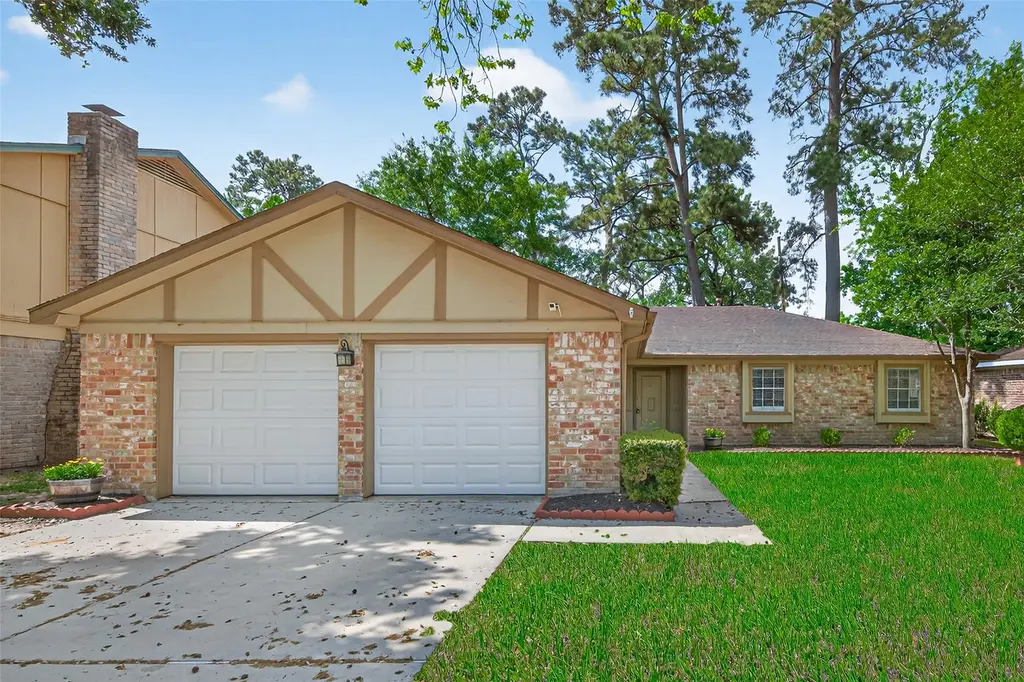
23919 Farm Hill Rd
Spring, TX 77373
$225,000D
3 bd · 2.0 ba ·
1,678 sqft ·
Built 1975
· SingleFamily
· Pending
· 52 DOM
Cashflow @ list (25.0% down · 7.5%)
Estimated rent
$2,290/mo
Mortgage (P&I)
−$1,180
Tax + insurance
−$559
HOA
−$21
Vac / Maint / Mgmt
−$481
Net cashflow
$50/mo
Annual
$599/yr
Cap rate
6.56%
Cash-on-cash
0.95%
DSCR
1.04
1% rule
1.02%
Cash to close
$63,000
Investor read
- This is a 3-bed/2.0-bath single-family listed at $225k.
- At list price, monthly cash flow is $50 ($599/yr) — positive.
- The deal already cash-flows at list — no discount required.
- Meets the 1% rule at list price ($2k rent vs $225k).
- It's been on market 52 days — a 3% lower offer ($218k) is reasonable based on typical stale-listing flexibility.
- Recommended offer: $218k (3.0% below list) — sets the bar for market timing.
- Local home prices are declining (-3.0%/yr); year-one equity from $2k of loan paydown is wiped out by about $7k of value loss. Plan a longer hold.
- Location reads 66/100 on livability (#635 in TX) — a middle-class / working-renter tenant base. Strengths: cost of living A+, housing A+, employment B; Watch: crime D, amenities F, commute F.
- Spring ISD (suburban): math 19% / reading 26% proficiency, ranked #730 of 826 in TX (top 88%) — low school quality limits family demand, transient renter base, plan for 1-2y turnover; 66% free/reduced lunch — lower-income household profile, screen leases tightly.
- Zoned schools: Twin Creeks Middle (math 23% / reading 24%, grade F, #1,317 of 1,662 statewide, top 80%, 973 students, 83% FRL); Spring H S (math 12% / reading 21%, grade F, #1,497 of 1,632 statewide, top 92%, 2,760 students, 72% FRL).
- Market conditions: Rents soft (-0.3%/yr); 595 active listings in the ZIP; solid renter incomes; 29,883 units permitted in Harris County in 2024 (8,621 in 5+ unit buildings).
- Harris County population projected at +47% by 2050 — long-run rental-demand tailwind backs the buy-and-hold thesis.
- 5 sale attempts with the ask held roughly flat each time — persistent listings suggest the price (not the market) is what's stuck; bring a comps-based counter.
- Climate carrying-cost: severe wind risk, 99% chance of damaging wind over 30y; extreme-heat days projected 7→24/yr by 2055 (HVAC capex compounding) — expect insurance premiums to compound above CPI over the hold.
- Cap rate 6.6% vs local median 4.5% in Spring — top-decile yield for the area; either an underpriced asset or a hidden risk that comps aren't pricing in. Stress-test before assuming the spread holds.
- This rent runs 31% of the median local income ($89k/yr) — at the standard rent-burdened threshold; future hikes will face affordability resistance.
Questions for listing agent
- It's been on market 52 days. Have you received any prior offers? Is the seller open to a 3% concession, seller financing, or rate buy-down credit?
- Built in 1975 — when were the roof, HVAC, electrical panel, plumbing, and water heater last replaced?
- What does the HOA fee cover, when was the last increase, and are there any pending special assessments or reserve-fund shortfalls?
- Is there a deadline driving the sale (1031 exchange, divorce, estate, relocation)? That informs how much negotiation room exists.
- Crime grade is D in this area — have there been break-ins, vandalism, or insurance claims at this property in the last 3 years? What carrier currently insures it and at what premium?
- The area grade is low — what's the realistic commute time and amenity access for the typical tenant pool here? Any planned neighborhood developments (good or bad) we should know about?
- What's the average days-on-market for RENTAL listings here right now (not sales)? A rising rental-DOM trend means longer vacancies and softer asking-rent achievability than the comps imply.
- What's the recent tenant-quality profile in this submarket — average credit score on applications, eviction rate, late-payment / NSF rate, and stable-employment percentage? A property-management company in the area should have these aggregated.
CashFlowRE · CFR-RV9H9CEV58Y5A6
· Data 3 weeks ago
cashflowre.app · 2026-05-29